Build Dashboards in Intelligence
LiveRamp Clean Room's integrated visualization tool, Intelligence, enables users to take the outputs of clean room questions and question runs and create reports and dashboards encompassing charts, tables, and other visualizations.
Here, we'll review how to create dashboards in Intelligence. Dashboards are a compilation of multiple reports with additional features to make your dashboards interactive. Dashboards can show different cuts of the same question or combine reports across multiple questions in a dashboard.
To access Intelligence, enter a clean room and select Intelligence from the navigation pane.
Overall Steps
Create a Dashboard
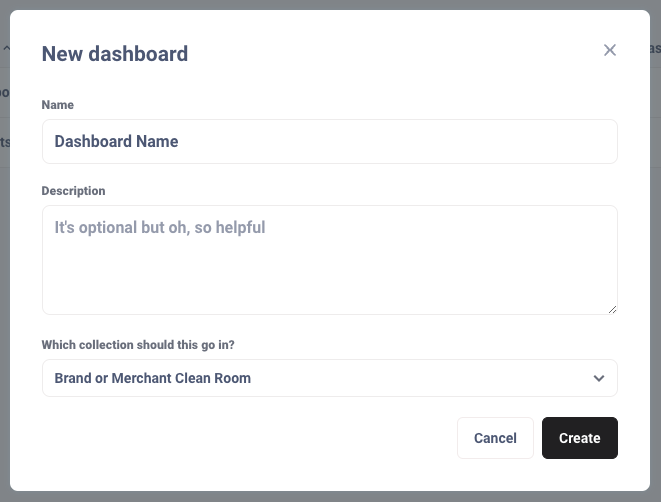
From the collection where you want your report to live, select New → Dashboard.
Give the dashboard a name and an optional description, and confirm it is saved in the correct collection.
Click .
A dashboard canvas will display in edit mode. There are five main options on the right to add components to the dashboard:

 : Add questions, which are existing reports previously created.
 : Add text boxes, used to author dashboard descriptions or to create navigation tiles.
 : Add link card; used to create a clickable card on the dashboard that clicks to another dashboard or report.
 : Add filters to enable users to filter down the data in the dashboard reports.
 : Add click behaviors, used to add different types of clickable buttons to a dashboard with custom definitions.
You can save the dashboard at any time by clicking in the upper right of the canvas.
Add Reports
Click the plus
icon.Navigate to the collection which contains the reports that you want to add to the dashboard.
Click on each report to add it to the dashboard canvas.
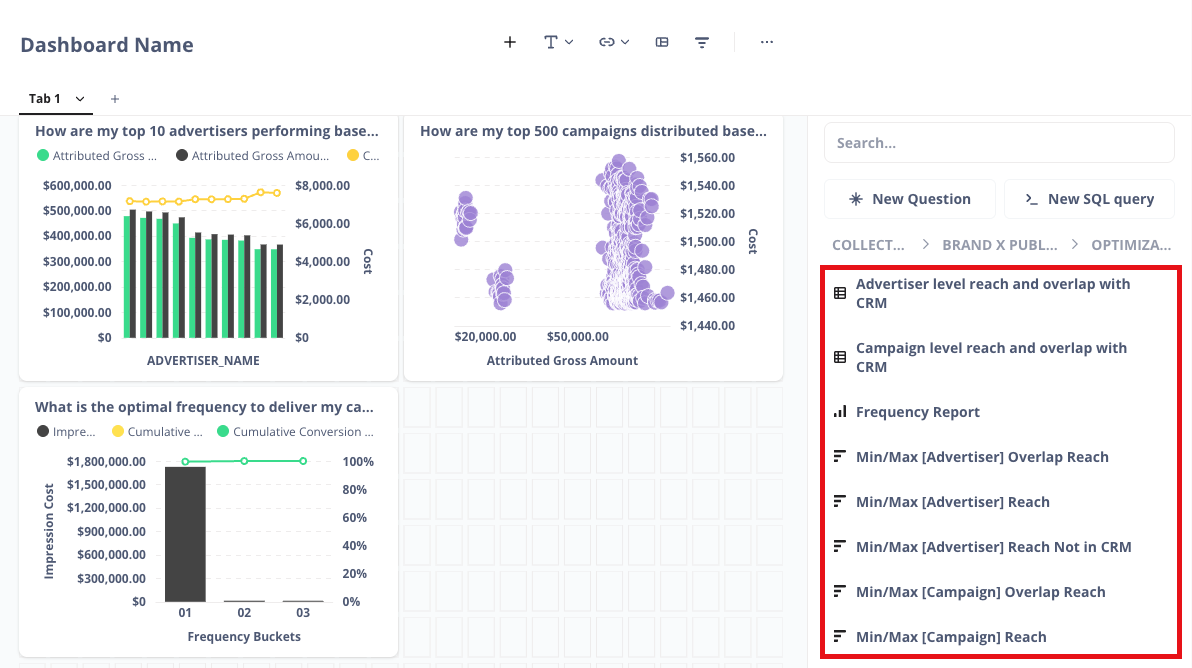
Drag the reports to place them on different areas of the canvas. Drag the lower-right corner of a report to resize it.
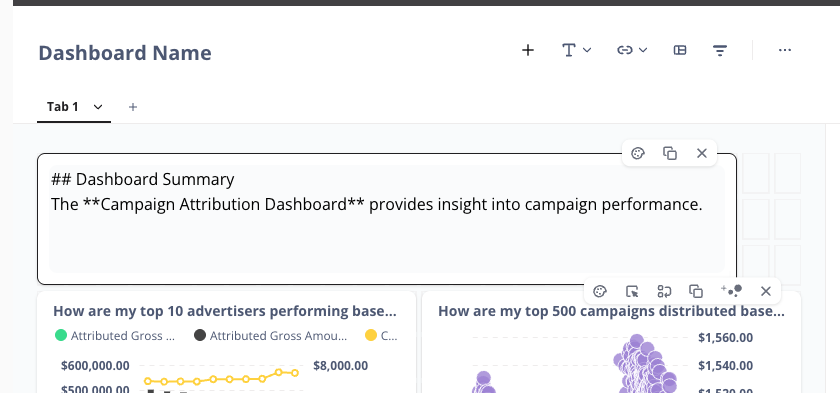
Add a Text Box
Click the text box icon. Select "Heading" to add header texts into your dashboard, or "Text" to add sentences or paragraphs. Text boxes use Markdown to format text, for example:
Hashtags: Add a hashtag "#" and a [Space] prior to your text copy to display the largest text size. Up to six hashtags can be used to make text smaller.
Double asterisks: Add double asterisks "**" on either end of the text to bold it.
Single asterisks: Add single asterisk "*" on either end of the text to italicize it.
Dash: Use to create a bullet for a bulleted list.
Emojis: Copy and paste emojis into a text box to add extra detail and imagery.
General Markdown guidelines can be used for additional formatting options.
Text boxes also include the following options by hovering over the upper right of the text box:
 : Toggle between preview and edit mode for copy in a text box.
 : Visualization options to align text copy vertically and horizontally in a text box.
 :Delete a text box from the canvas.
In addition to authoring dashboard descriptions, text boxes can also be used to create clickable navigation tiles to navigate between dashboards or reports. When using Markdown:
Hashtags: Add a hashtag "#" and a [Space] prior to your text copy to display the largest text size. Up to six hashtags can be used to make text smaller.
Brackets: Enter your text copy in between brackets.
Parenthesis: Enter the URL the tile should click through to in between parenthesis. If you are linking to a dashboard or report, navigate to it and copy and paste the URL here.
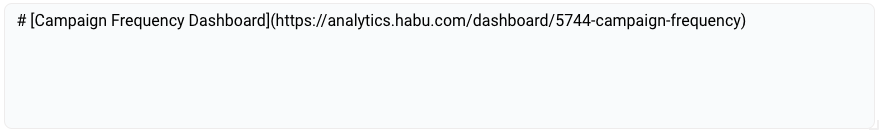
The tile will now include a clickable link that will navigate to the destination URL.
Add Filters to a Dashboard
Click the filter
icon. Choose the category that defines the column you want to filter on. For example, if it is a date-based column, select "Time". If it is a location-based column such as city, select "Location".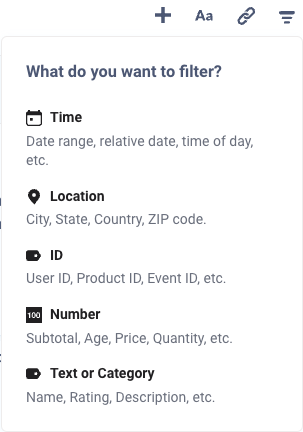
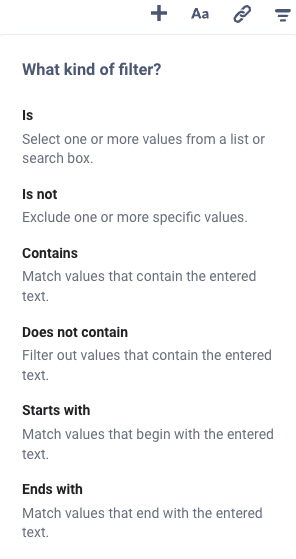
Select the filter type.
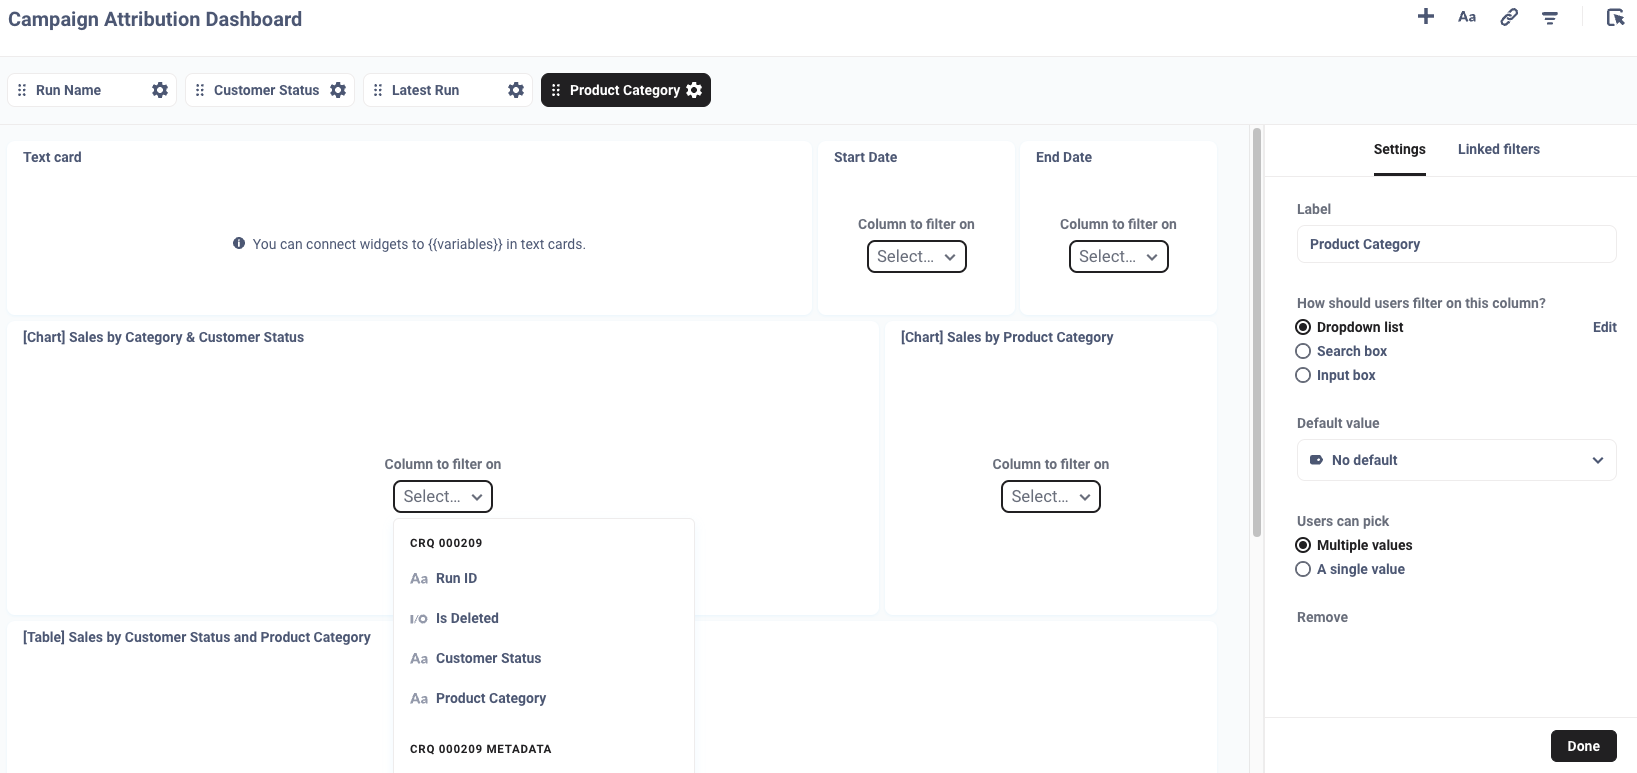
Enter a filter name in the Label field. Then, apply the filter to each report you want filterable by that column by selecting it from the dropdown list.
Select the Filter type from the dropdown list. Options include:
Time
Location
ID
Number
Text or Category
Based on the filter type, you may have to define a Filter operator to specify the criteria. You can select one of the following options:
Based on the filter type, you may have to define how users should filter on the value chosen. Options include:
dropdown list
Search box
Input box
To apply a default filter value, select from the Default value dropdown list.
Lastly, define how users can select values within that filter. Options include:
Multiple values
Single value
Click .
Add Click Behaviors
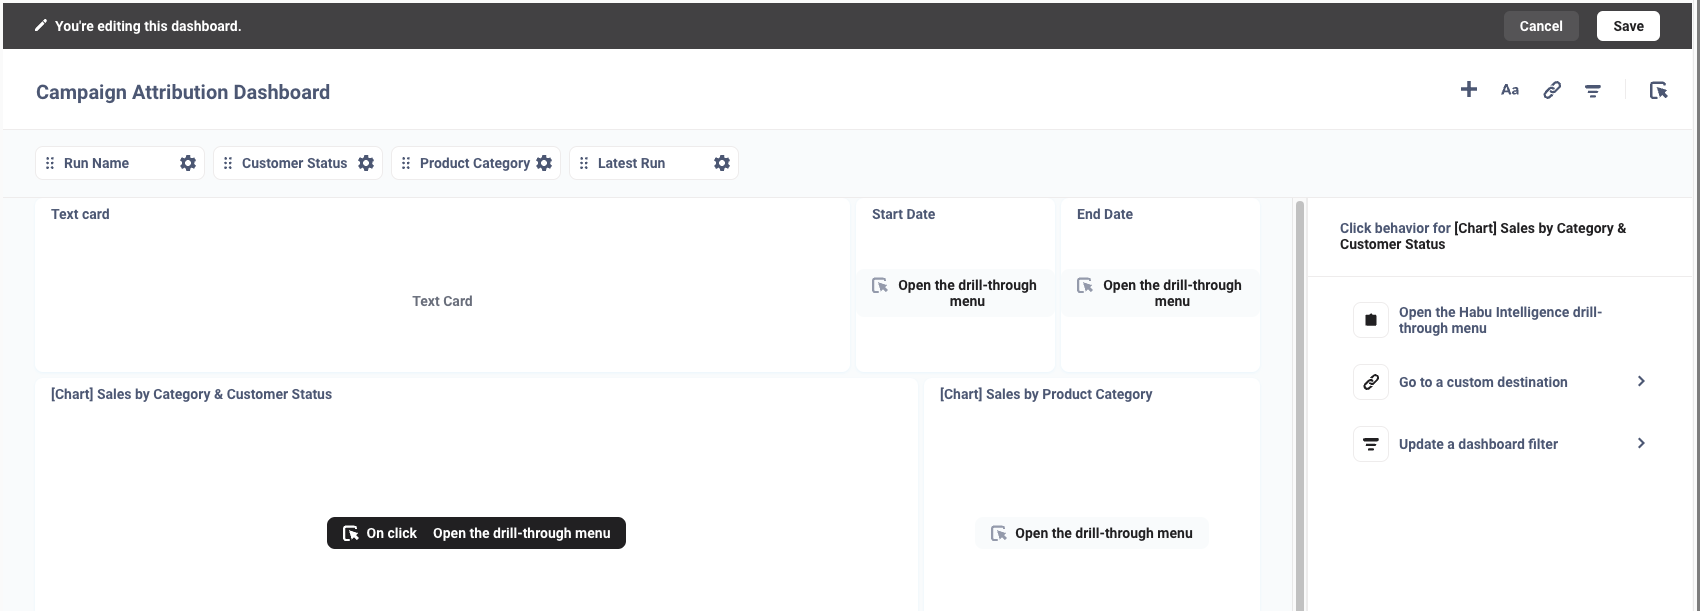
You can apply click behaviors to reports to make them clickable to other reports. To add a click behavior, hover over a report in your dashboard and click the arrow
icon.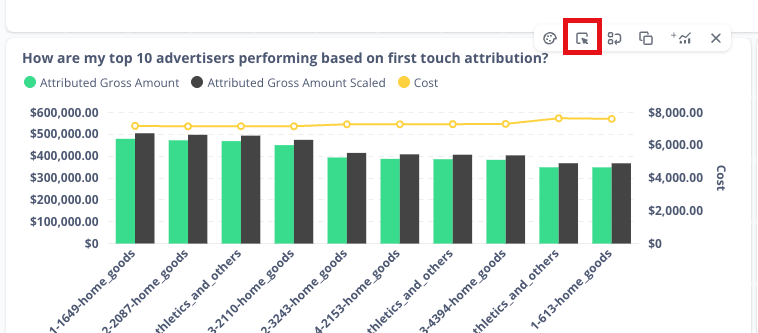
In the configuration screen, the report selected will be highlighted. The available click behavior options are:
Open the Intelligence drill-through menu: This is the default setting. If a user clicks on a report within a dashboard, they will be navigated to an expanded version of that report.
Go to a custom destination:
Dashboard: Select an existing dashboard from a collection for the report to click through to.
Saved question: Select an existing report from a Collection for the report to click through to.
URL: Define filtered versions of dashboards or reports for the report to click through to.
Update a dashboard filter: Select a filter default for a particular report.
Click .
Click to save your dashboard.
Note
For information on click behaviors, see "Interactive Dashboards" in the Metabase help.
Once you have finished building your dashboard, you can set up subscriptions to periodically share the results via email, including to people who lack clean room access. For more information, see "Subscribe to a Dashboard".