Build Reports in Intelligence
LiveRamp Clean Room's integrated visualization tool, Intelligence, enables users to take the outputs of clean room questions and question runs and create reports and dashboards encompassing charts, tables, and other visualizations.
Reports are visual representations of a clean room question output and consist of table joins as referenced in Question Management.
This article walks you through building a report in Intelligence to visualize data queried in a clean room.
To access Intelligence, enter a clean room and select Intelligence from the navigation pane.
Defining a Query
There are two ways to define a query in Intelligence:
Define a query using the query editor
Define a query using the SQL editor
Define a Query With the Query Editor
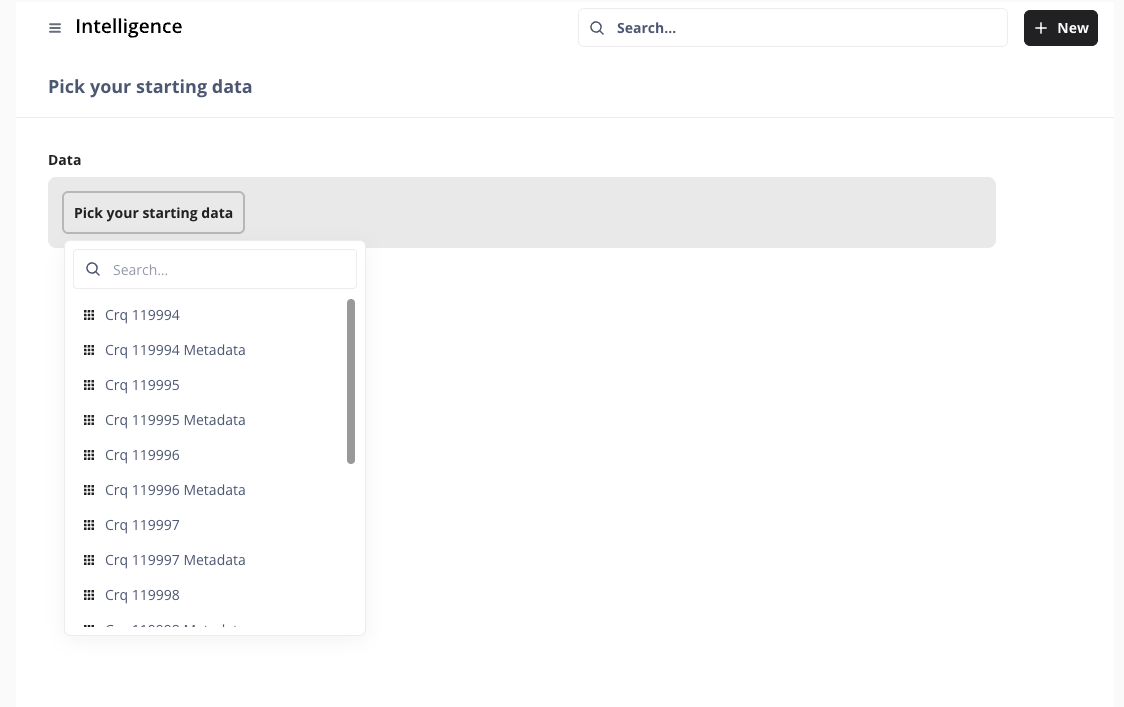
In Intelligence, go to the collection where you want your report to live and select New → Question.
Pick your starting data table by selecting a clean room from the dropdown list, followed by a source data table for the question you want to create a report for.
In Query Editor, select the join data icon
 and then select the source metadata table for your question.
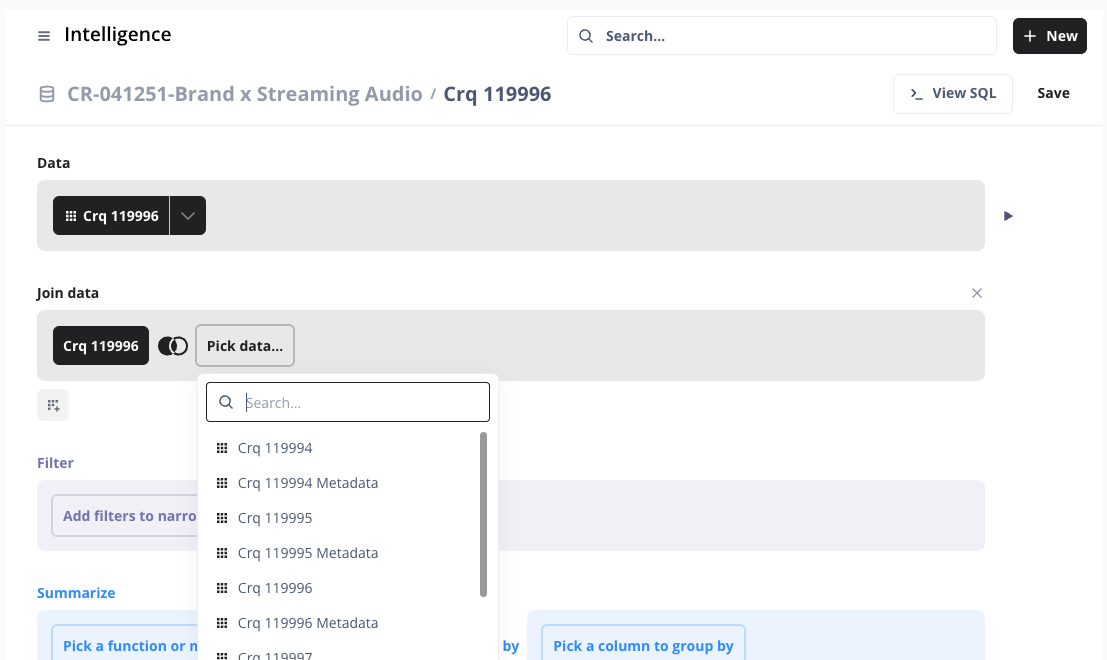
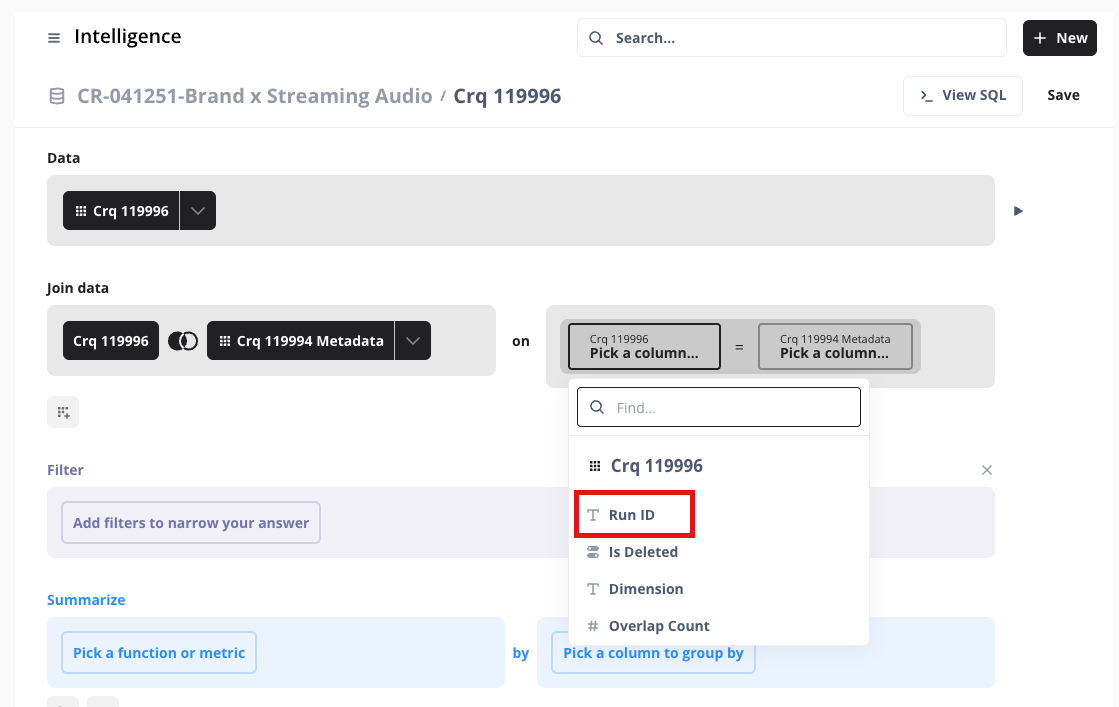
Select the Run ID to join the data and metadata tables on.
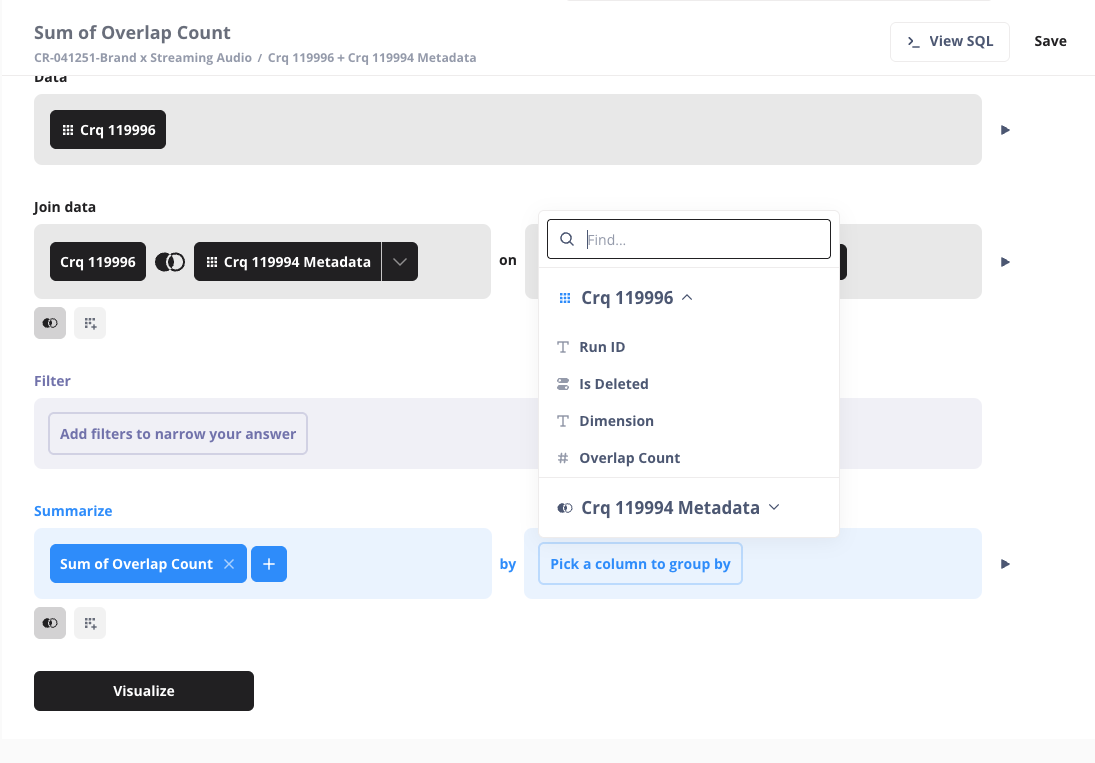
Under "Summarize", select one or more metrics to include in your report, starting with how each metric should be calculated (such as sum of), and the columns by which you want to group those metrics. Metrics and columns will populate based on what is in the source tables.
Other report options related to your source data include:
Custom Expression: Custom metrics calculation. For more information, see "Custom expressions".
Filters: Filter your report output by specific columns.
Sort: Select a metric to sort in ascending or descending order in your report output.
Row Limit: Set a cap on the number of rows in your report output.
Custom Column: Create a new column based on a custom expression.
Once the report output has been defined, click . You can navigate back to the Query Editor by clicking the show editor icon
 in the upper right-hand side of your screen.
Define a Query Using the SQL Editor
From the collection where you want your report to live, select New → SQL Query.
Pick your starting data table by selecting a clean room from the dropdown list.
Use the SQL Editor to author your query.
Click the play icon
 to preview your results. The preview chart or table will show below the SQL Editor.
Click the expand icon
 to minimize or maximize the SQL Editor.
If you have field filters within your query, use the variable icon
 to define the variables to use the filter widgets.
Once the report output has been defined, click Visualization to customize your report.
Customize the Visualization
Once you click , Intelligence will create a report in a default format (such as a bar chart). Click to change the type of visual.
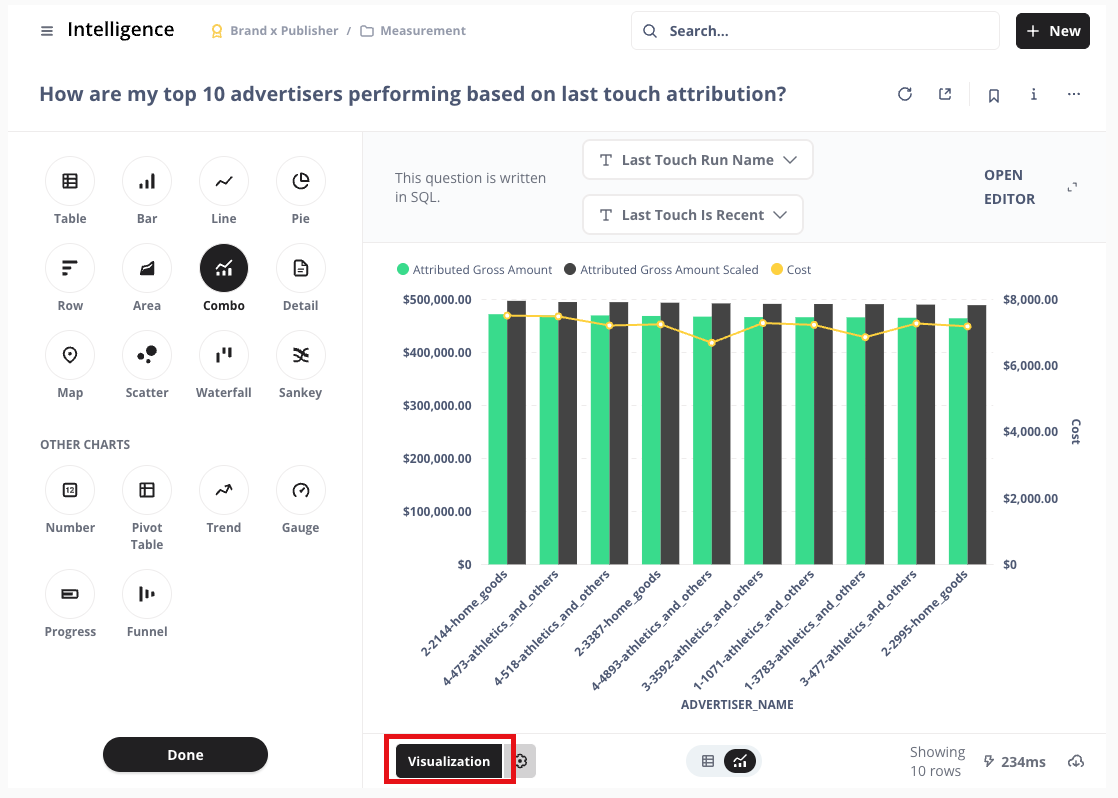
Click the Settings icon ( ) to customize the different components of your visual. Depending on the type of visual selected, the options will differ. See the options below for the most common types of visuals - bar charts, line charts, and tables.
Bar Charts and Line Charts
Data Tab: Change axes display names, value displays, and rearrange metrics and dimensions within your report.
Click the three dots next to a dimension to change the dimension name, bar or line color, display type (line VS bar), axis position, and the ability to display values on the bars or lines.
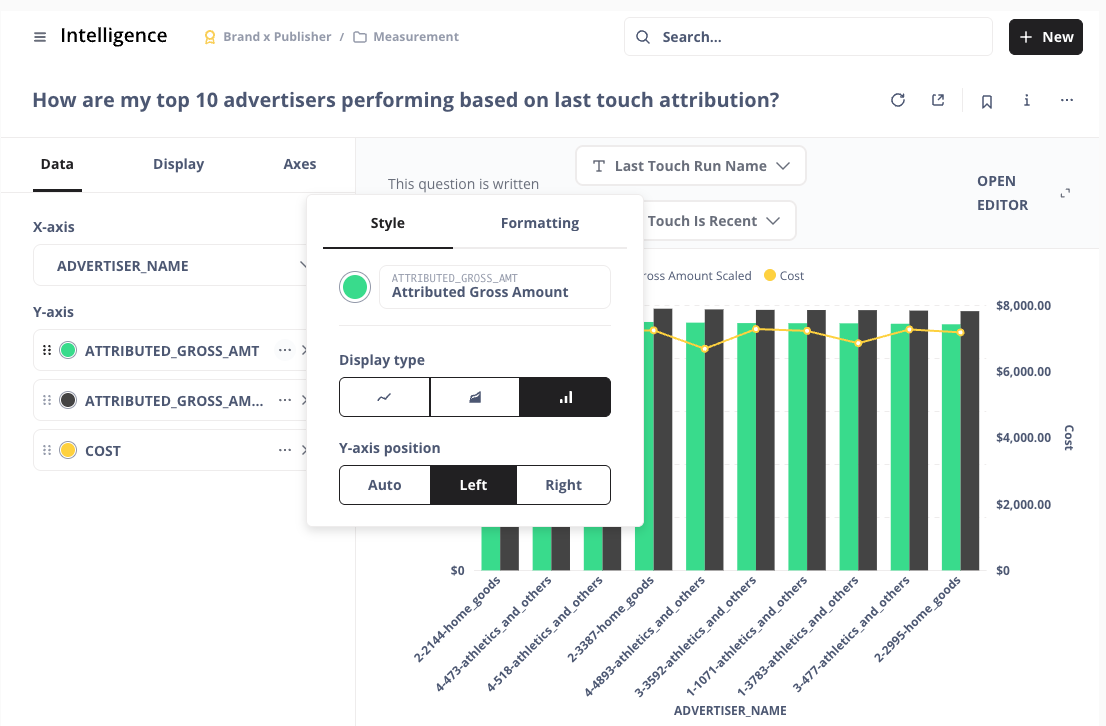
Click the three dots next to a metric to change the style (currency, percentage, etc), separator style (100,000 VS 100 000,00), number of decimal places, and to add a prefix ($) or suffix (%).
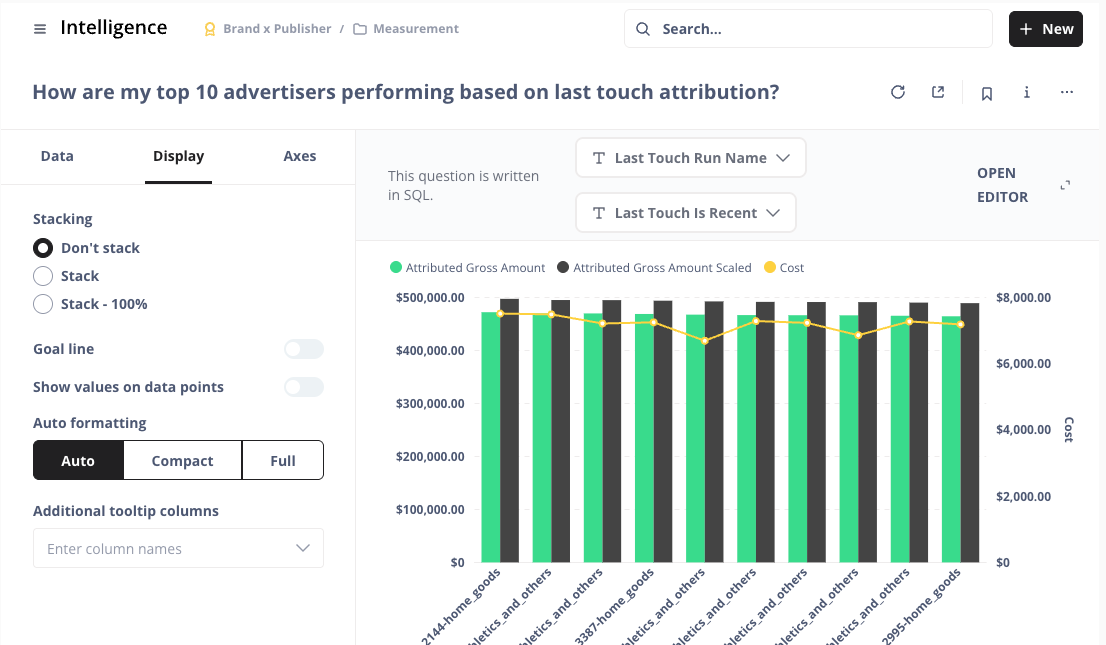
Display Tab: Change additional display components (i.e., stacked VS non-stacked bars), add a goal line, and display values on bars or lines.
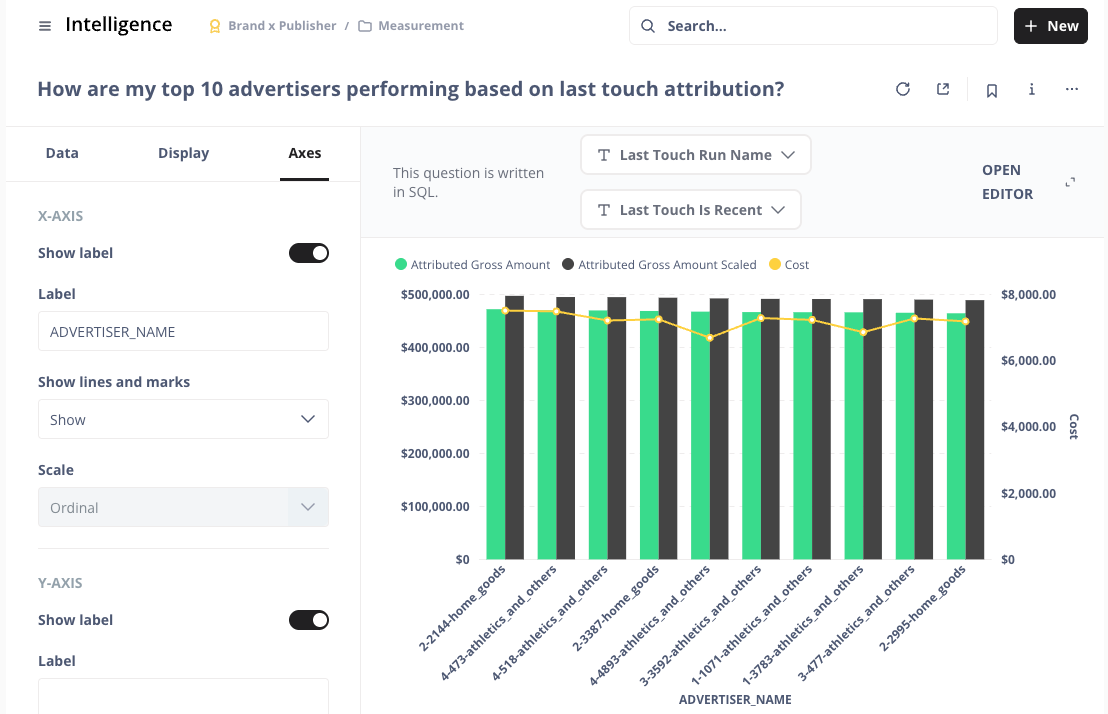
Axes Tab: Change axes labels, hide labels, and change how markings are displayed (i.e., compact, angled).
Tables
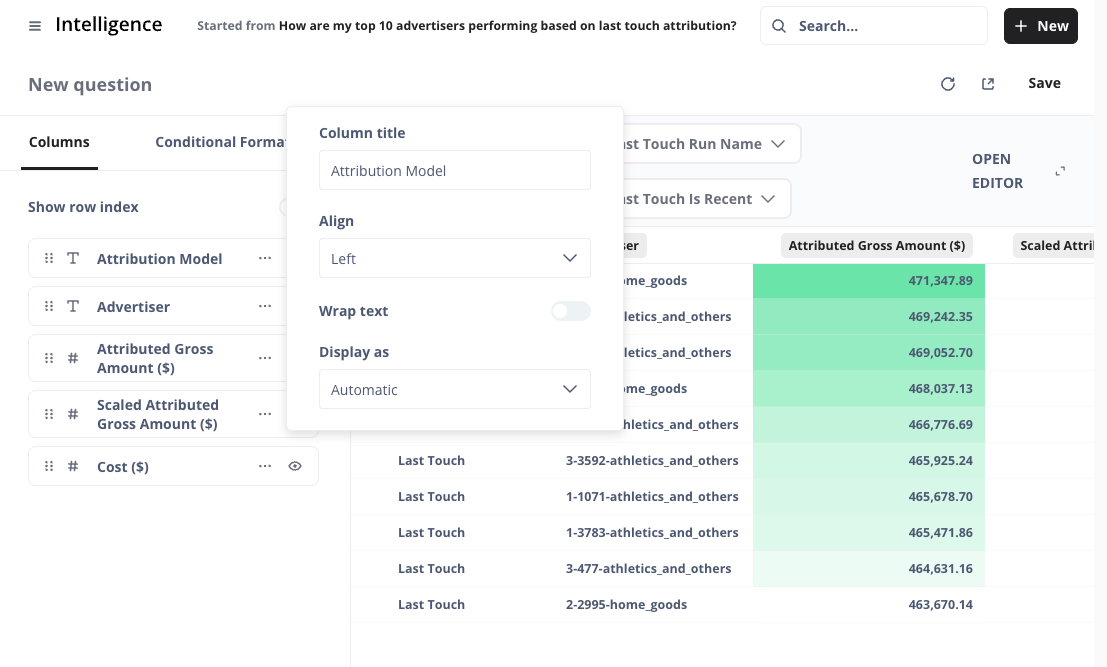
Columns Tab: Change column names and display types, create a pivot table, and rearrange the column order.
Click the three dots next to a dimension to change the column name and display type (i.e., text, link).
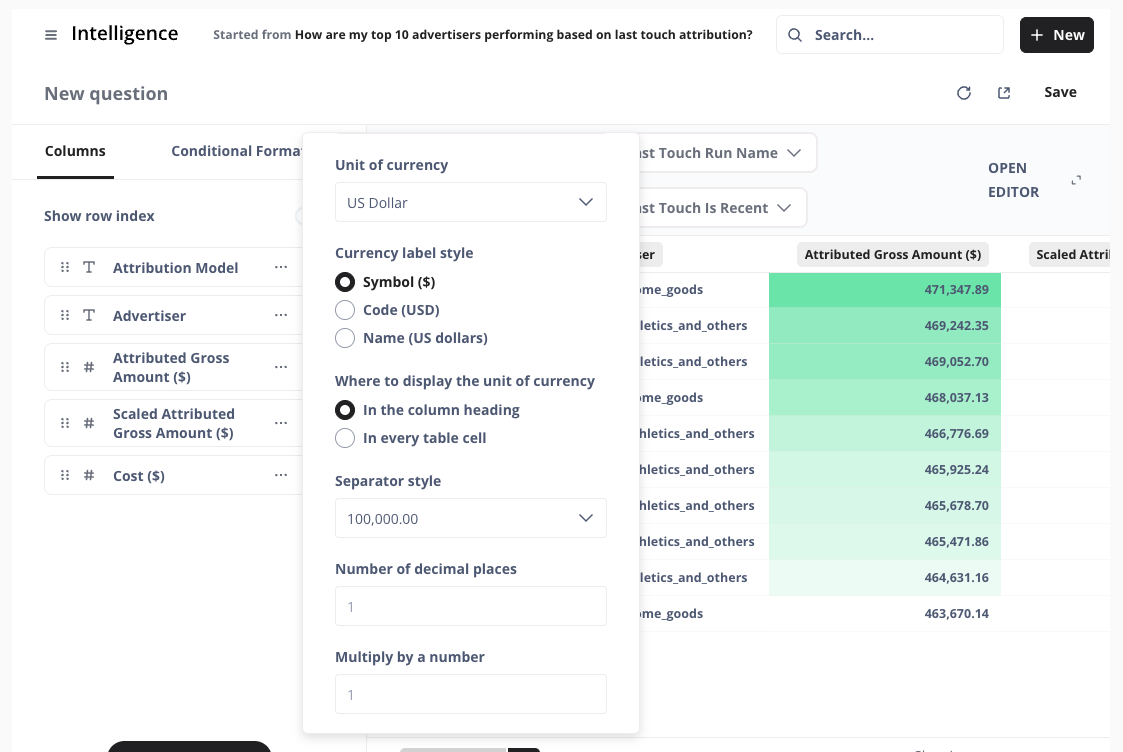
Click the three dots next to a metric to change the column name, style (currency, percentage, etc), separator style (100,000 VS 100 000,00), number of decimal places, and to add a prefix ($) or suffix (%).
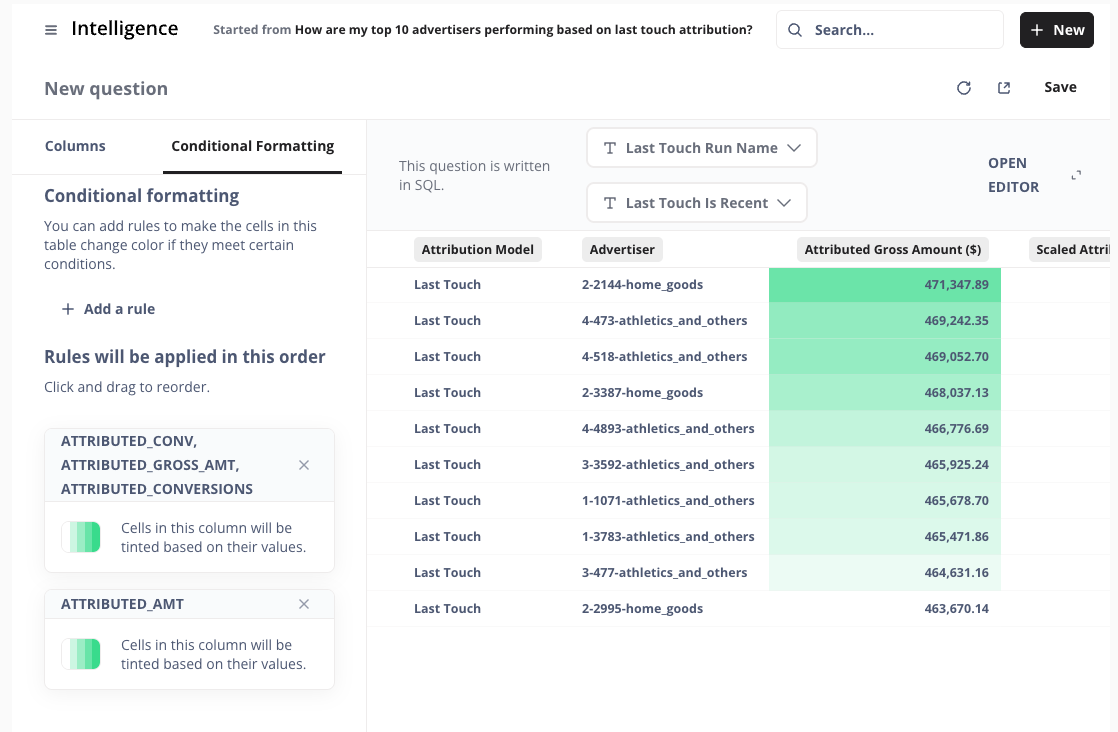
Conditional Formatting Tab: Add rules to change the color of the cells in the table if they meet certain conditions.
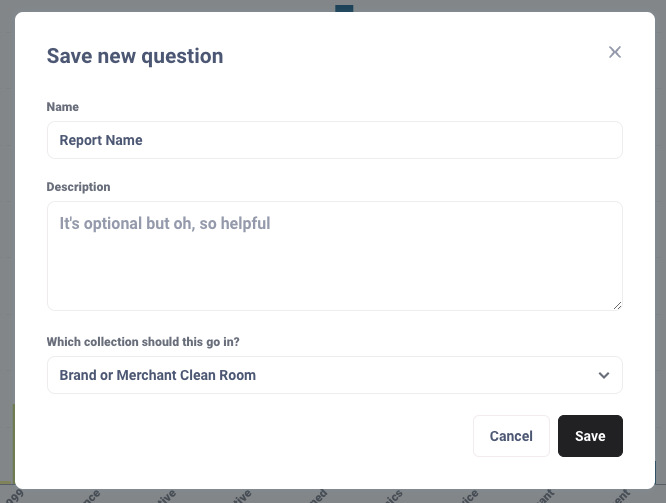
Save the Report
Once you complete your customizations, give your report a name and an optional description, and confirm it is saved in the correct collection. Click .
 |