Intelligence Best Practices
LiveRamp Clean Room's integrated visualization tool, Intelligence, enables users to take the outputs of clean room questions and question runs and create reports and dashboards encompassing charts, tables, and other visualizations.
Learn the best practices when utilizing Intelligence so you can work with reports and dashboards more efficiently.
Add a Run Filter to a Dashboard
Adding a run filter enables users to filter dashboard results based on one or more runs. Each newly created run for a question will automatically be added to your run filter dropdown in a dashboard. To create a run name filter:
Click the filter
 icon.
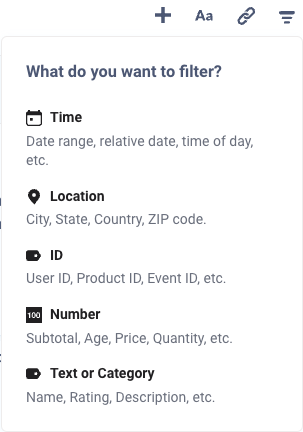
icon.Select Text or Category and then filter by "Is".
Update the Label to say "Run Name". For each report in the dashboard, select the dropdown, then Run Name.
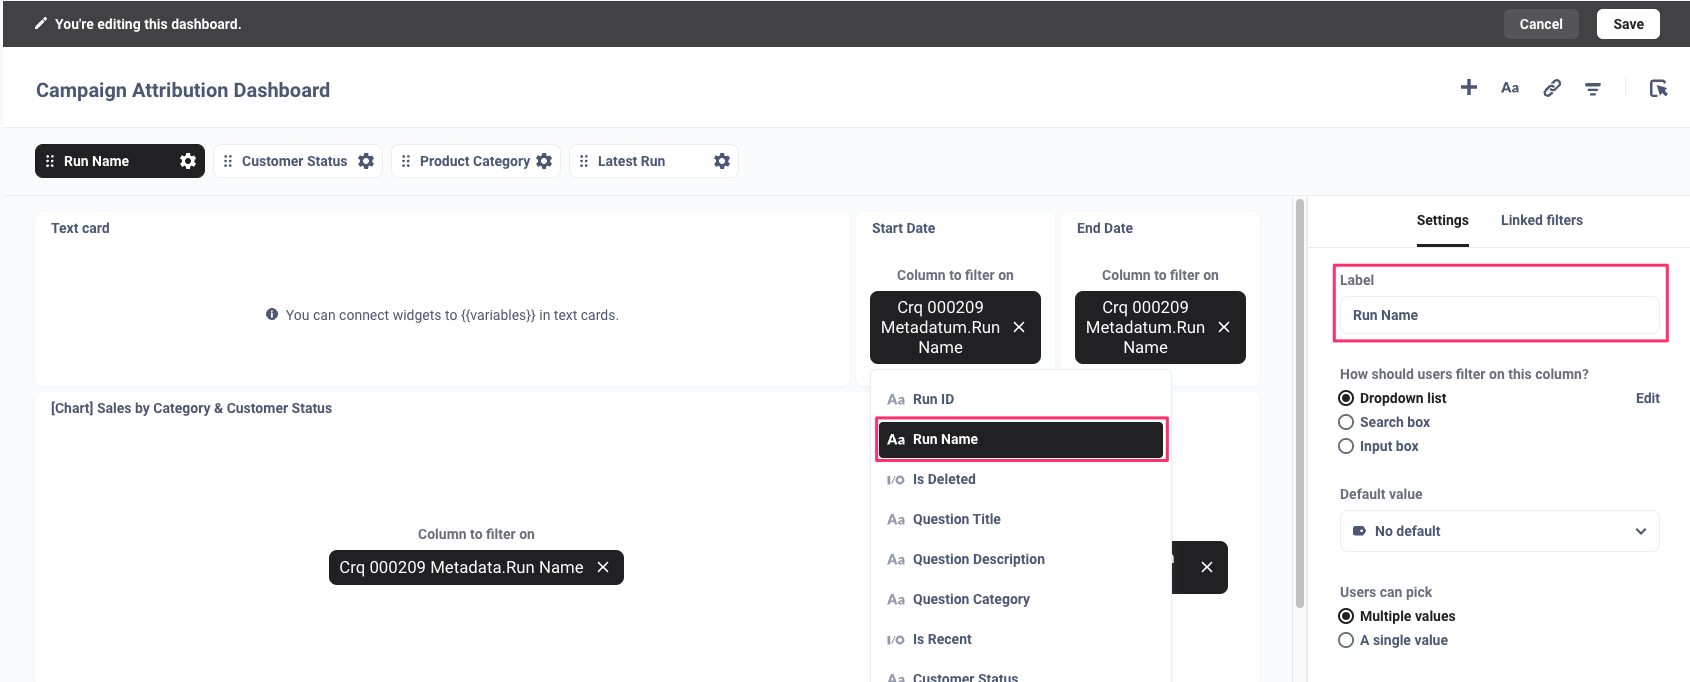
Click and save your dashboard.
Add a Latest Run Filter to a Dashboard
The latest run filter can be added to your dashboard so that results default to the latest question run. You can remove the Is Recent filter value of "true" to filter by other runs in the live dashboard.
Click the filter
icon.Select Text or Category → Dropdown.
Update the Label to say "Latest Run". For each report in the dashboard, including date reports, select Is Recent from the list. In the Default value list, select true.
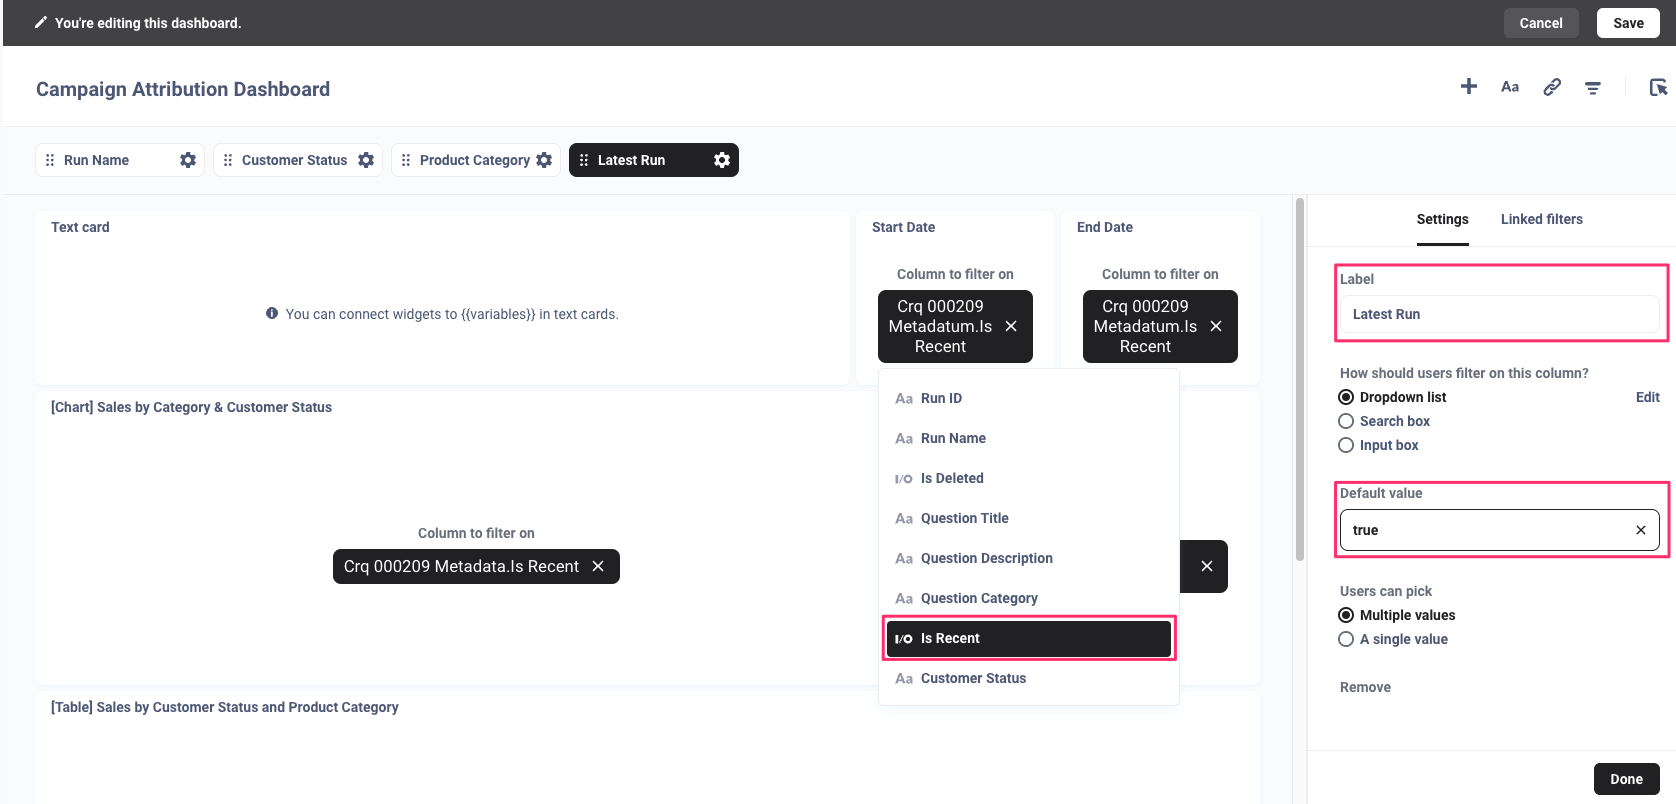
Click and save your dashboard.
Add Start and End Dates to a Dashboard
Start and end date reports can be added to a dashboard to display the dates that dashboard reports are filtered by. The dates will dynamically change when filtering on different run names in the dashboard.
Select New → Question.
Select the metadata table for the question for which you want to display dates. This ensures the runtime parameters for that specific question are referenced in the dashboard.
Note
You do not need to join the metadata table to any other table.
Under "Summarize" select Pick a metric → Minimum of → Start date (by day).
Click .
Under Settings, select the date and time format of your choice.
Click .
Repeat the above steps to create an End Date report, except under "Summarize" select Pick a metric → Maximum of → End date (by day).
Subscribe to a Dashboard
Dashboard subscriptions allow you to send the results of questions on a dashboard to people via email, even to people who do not have clean room access. The dashboard and its related reports will retain their visual format in the email content.
Tip
For one-time delivery, click .
If your dashboard contains multiple tabs, navigate to the tab which contains the data you want to subscribe to.
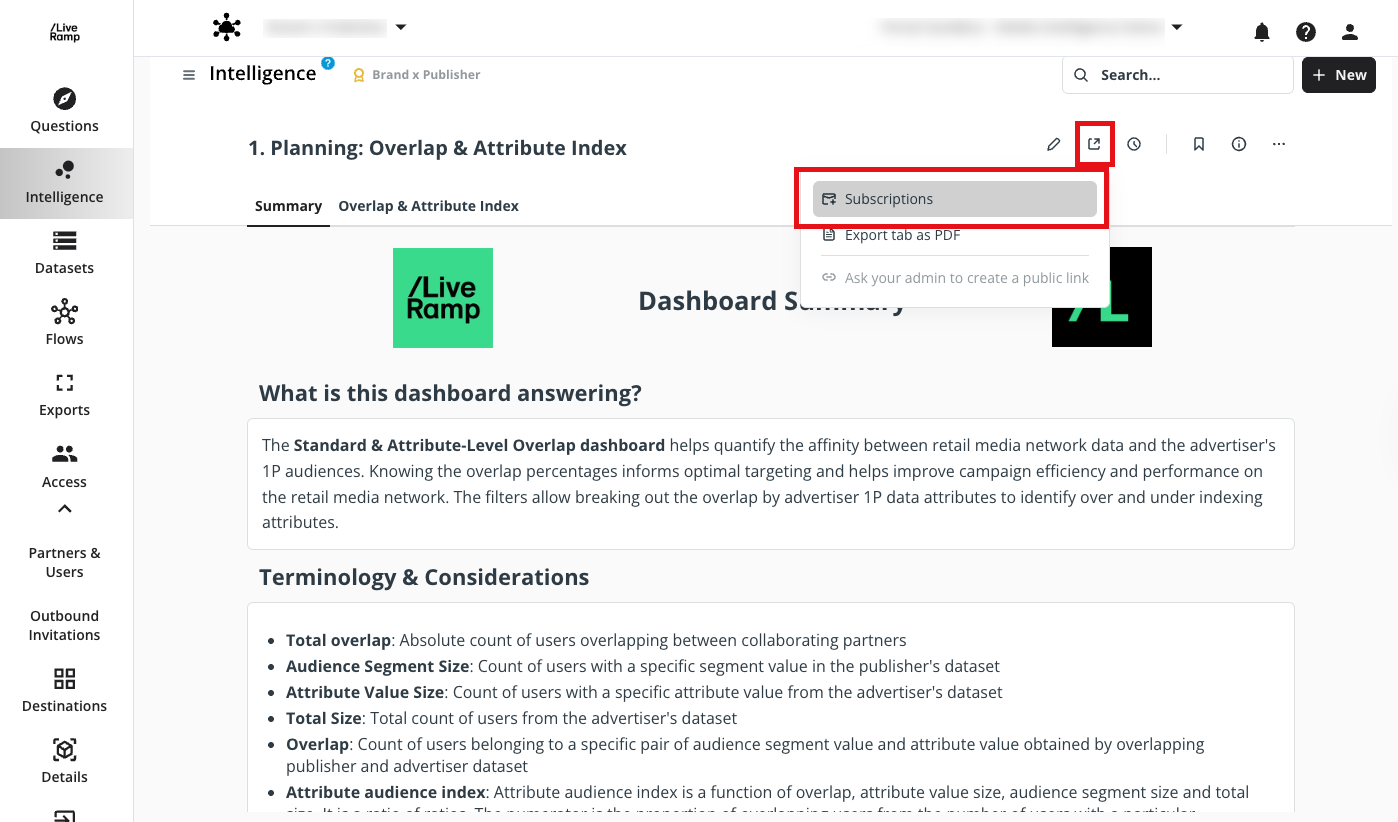
Click the Sharing icon and select "Subscriptions".
In the side panel that opens, enter the recipients' email addresses.
Determine the frequency of the email, which can be sent:
Hourly
Daily
Weekly
Monthly
Then, configure the time of delivery.
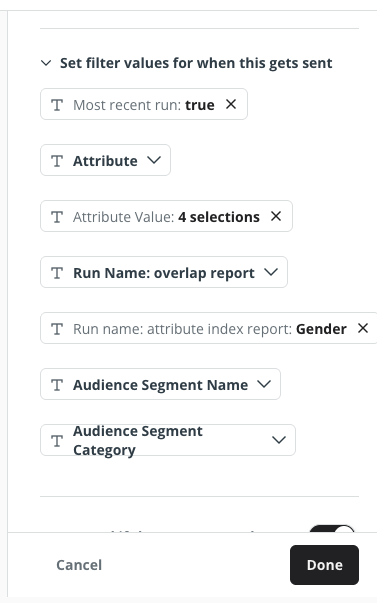
If your dashboard contains filters, expand the "Set filter values for when this gets sent" option to define which data from your dashboard to include in the email.
To skip sending the email when there are no results, slide the "Don't send if there aren't results" toggle.
To have the results attached as separate files, slide the "Attach results as files" toggle. Then, configure the following:
Note
File attachment will only contain the raw, unformatted results with no visual formatting applied.
The format of the file, which can be .CSV or .xlsx.
The questions/report to include. If not configured, no attachments will be sent.
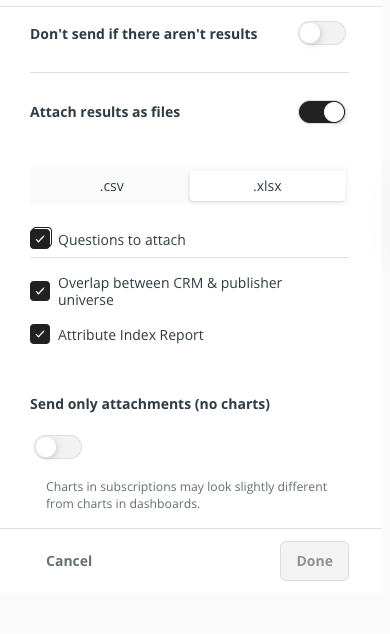
(Optional) To only send attachment files without the visuals in the email body, slide the "Send only attachments (no charts)" toggle.
Click .
Syncing Questions to Custom Data Tables
Note
This feature is currently available in limited release. To gain access, contact a LiveRamp representative.
You can create a custom data table with a name of your choosing to sync your question to. Custom data tables can be used as a placeholder to test how visualizations compare between different questions without having to change table references. It also allows you to more easily reference the question you want to visualize when building your report, instead of relying on question IDs.
When changing a question's data table, note the following:
If the question is being used in existing reports or dashboards, you must update the table reference manually in each report for the changes to be reflected.
You can sync your questions to any custom data tables, but you cannot sync them to other questions' system-generated data tables.
When syncing to an existing custom data table that is used by another question, the other question will sync back to its original, system-generated data table.
For example:
Question CRQ_123 is already syncing to the custom data table name "Table A". In Intelligence, "Table A" stores run data from CRQ_123.
You edit another question, CRQ_456, to use the table name "Table A".
Question CRQ_123 reverts to its original, system-generated data table "CRQ_123". In Intelligence, "Table A" now stores run data only from CRQ_456.
In a clean room, select the Questions tab.
From the question's More Options menu (
 ), select Edit Intelligence Table Name.
Enter a name for the data table to create one, or select an existing custom data table.
Caution
Custom table names must:
Not contain the term
metadataNot begin with
CRQUse no special characters other than underscores (_)
Click .
The question will now sync to the new data table. If you created a new data table, it appears on the Databases page.