The Clean Room Overview Page
If you have Questions page permission, you can use the Overview page within a clean room to monitor recent and in-progress runs, as well as see an overview of the clean room setup status.
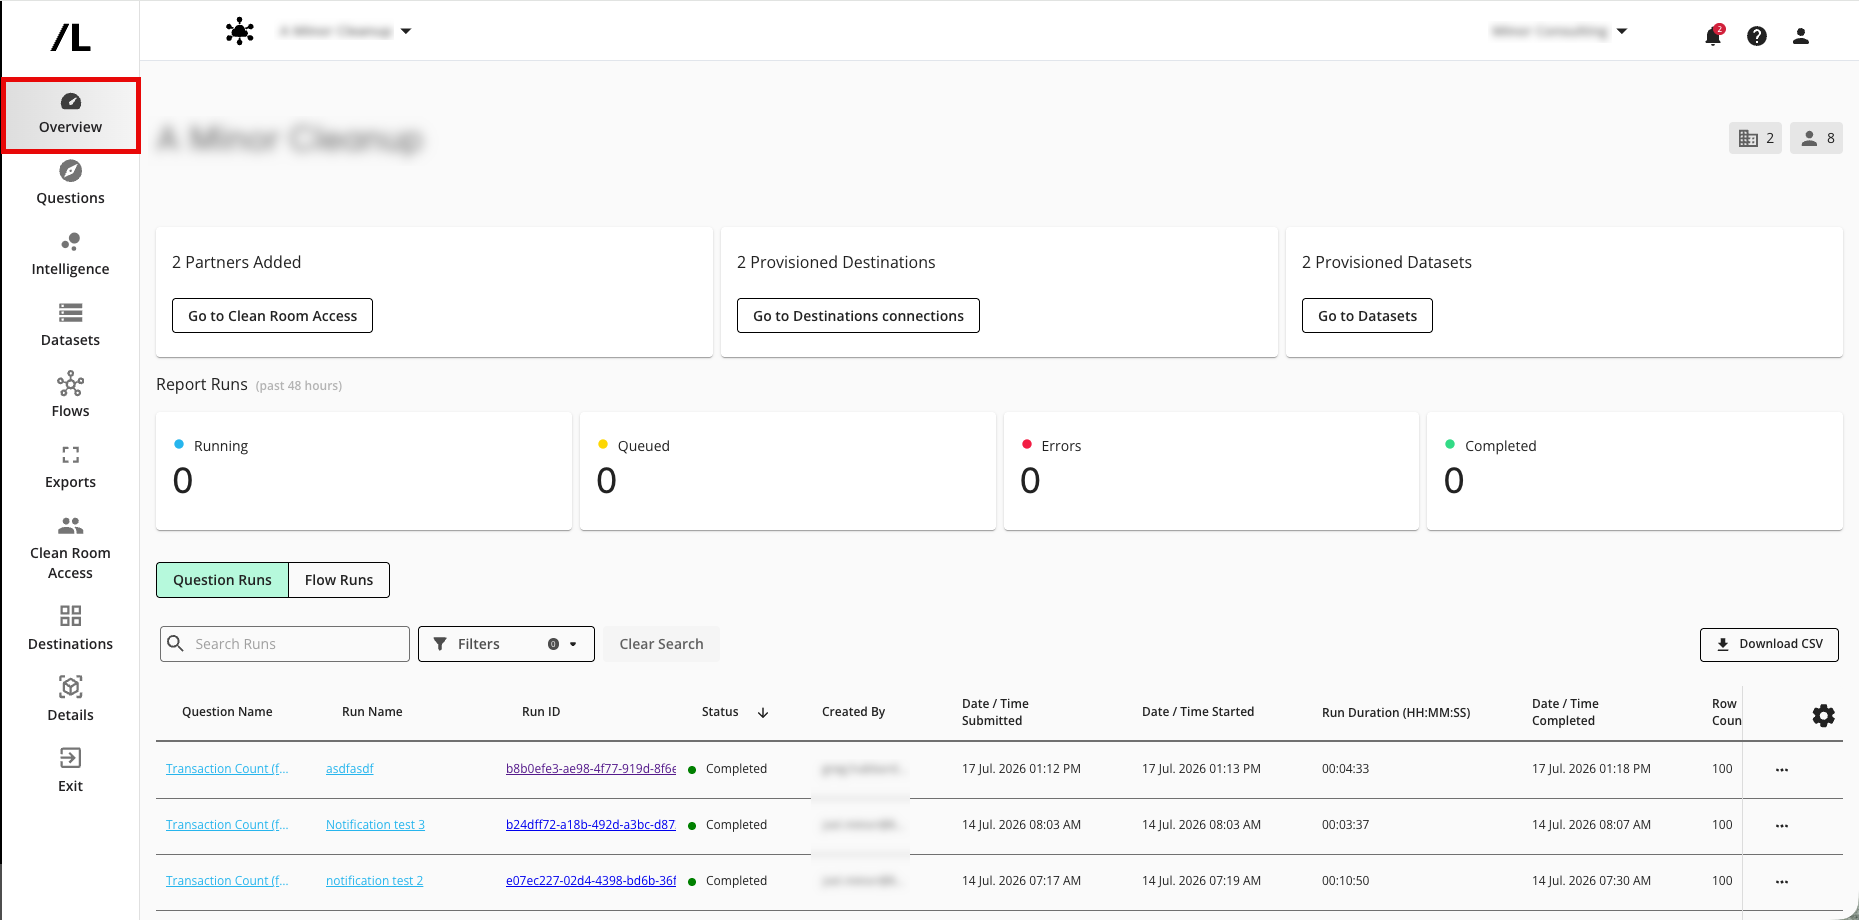
The Overview page is organized into three main areas:
The Clean Room Summary Area
The Run Summary Area
The Run Detail Area
See the sections below for more information on these areas.
The Clean Room Summary Area
The Clean Room Summary Area gives you a high-level view of the clean room:
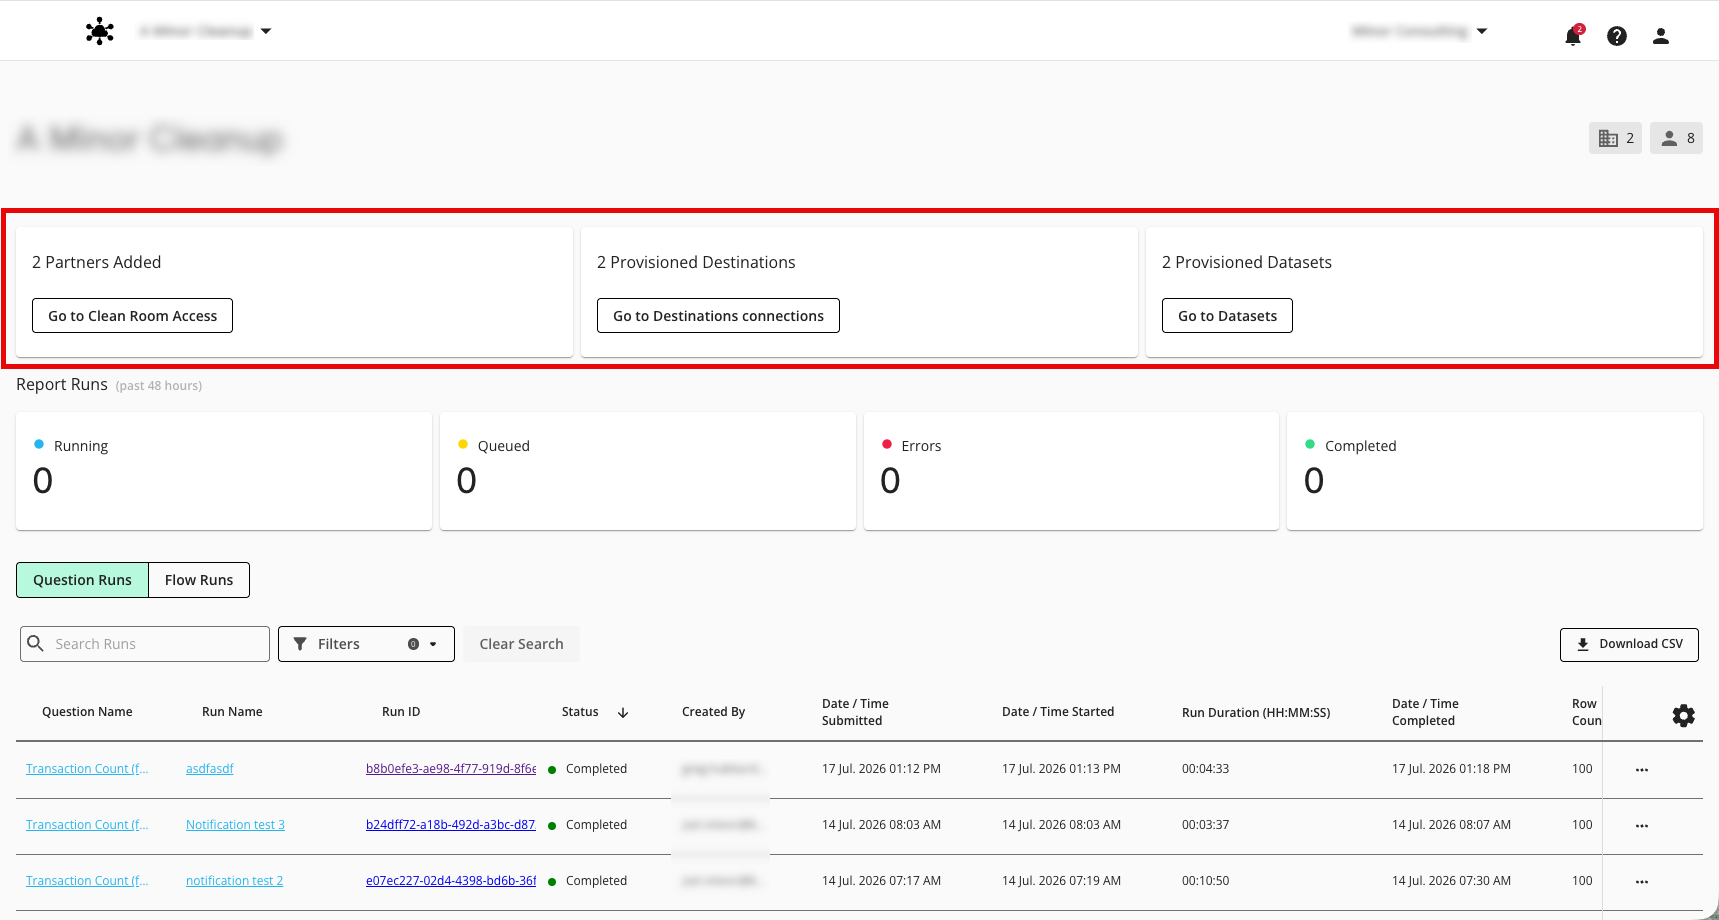
Partners added: Shows the number of partners that have been added to the clean room. To view or manage partners, click .
Provisioned destinations: Shows the number of export destination connections that have been provisioned to the clean room. To view or manage provisioned destination connections, click .
Provisioned datasets: Shows the number of datasets that have been provisioned to the clean room. To view or manage provisioned datasets, click .
The Run Summary Area
The Run Summary Area gives you a rollup of all report run activity during the last 48 hours so you can quickly understand what is happening in the clean room.
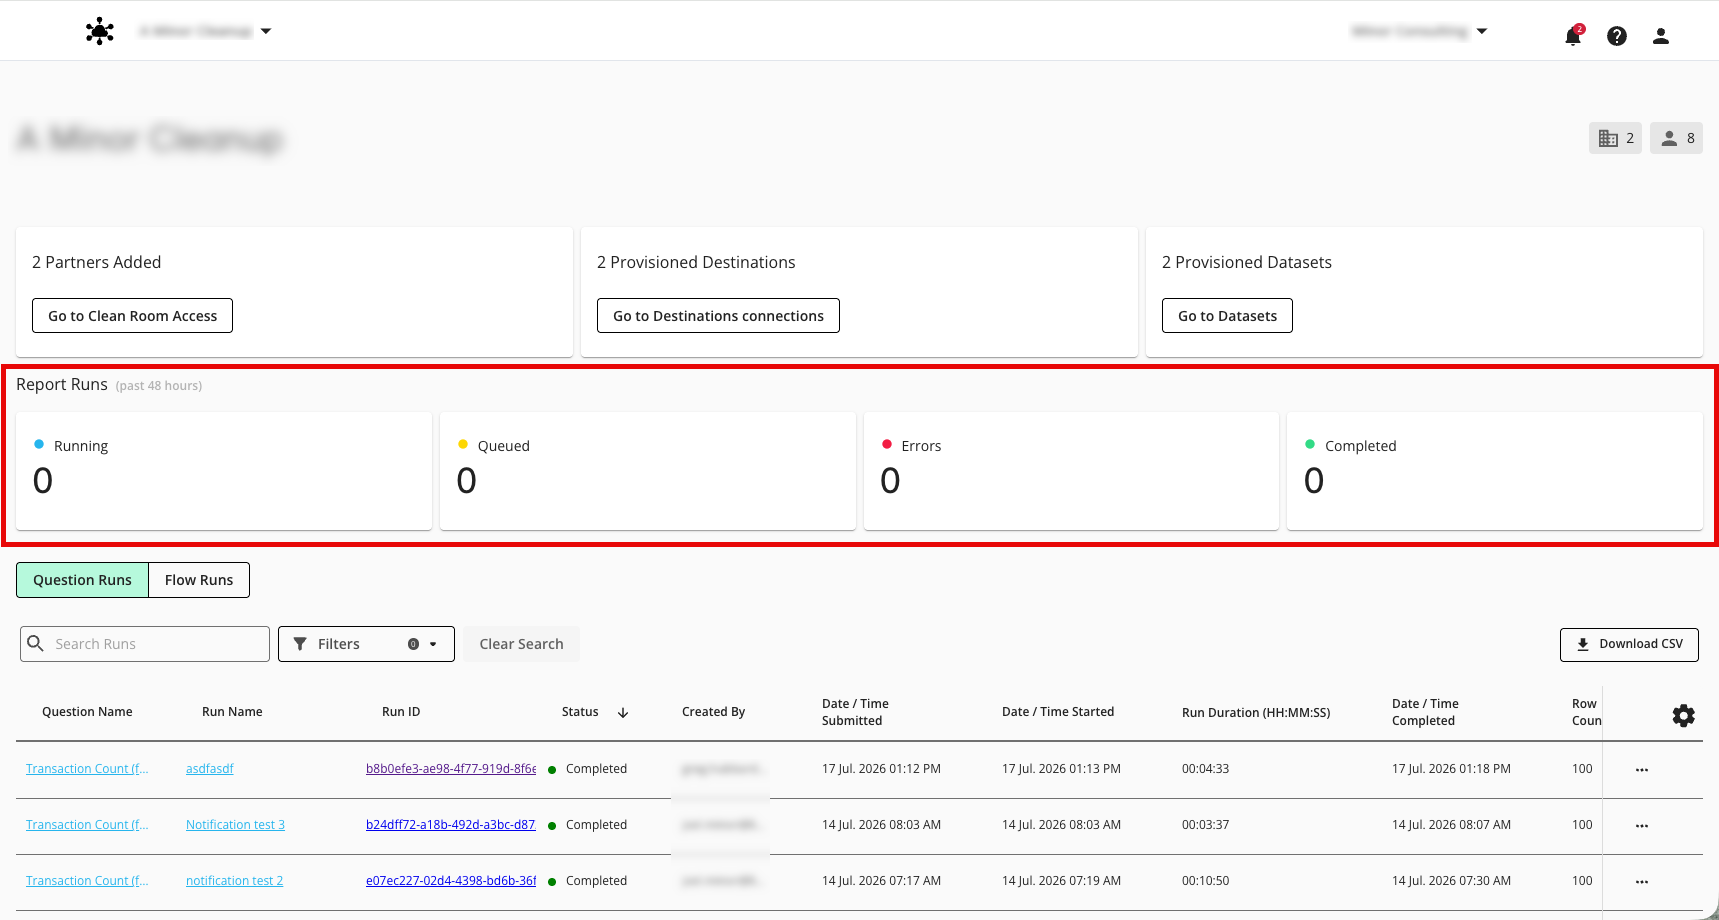
This area shows the number of report runs during the last 48 hours that have the following statuses:
Running
Queued
Failed (errors)
Completed
Use this area to quickly answer questions such as:
How many runs are currently in progress?
How many runs have recently failed?
How much activity has been happening recently in this clean room?
The Run Detail Area
The Run Detail Area shows the full history of question and flow runs in the clean room. This area helps you inspect and navigate individual runs in more detail.
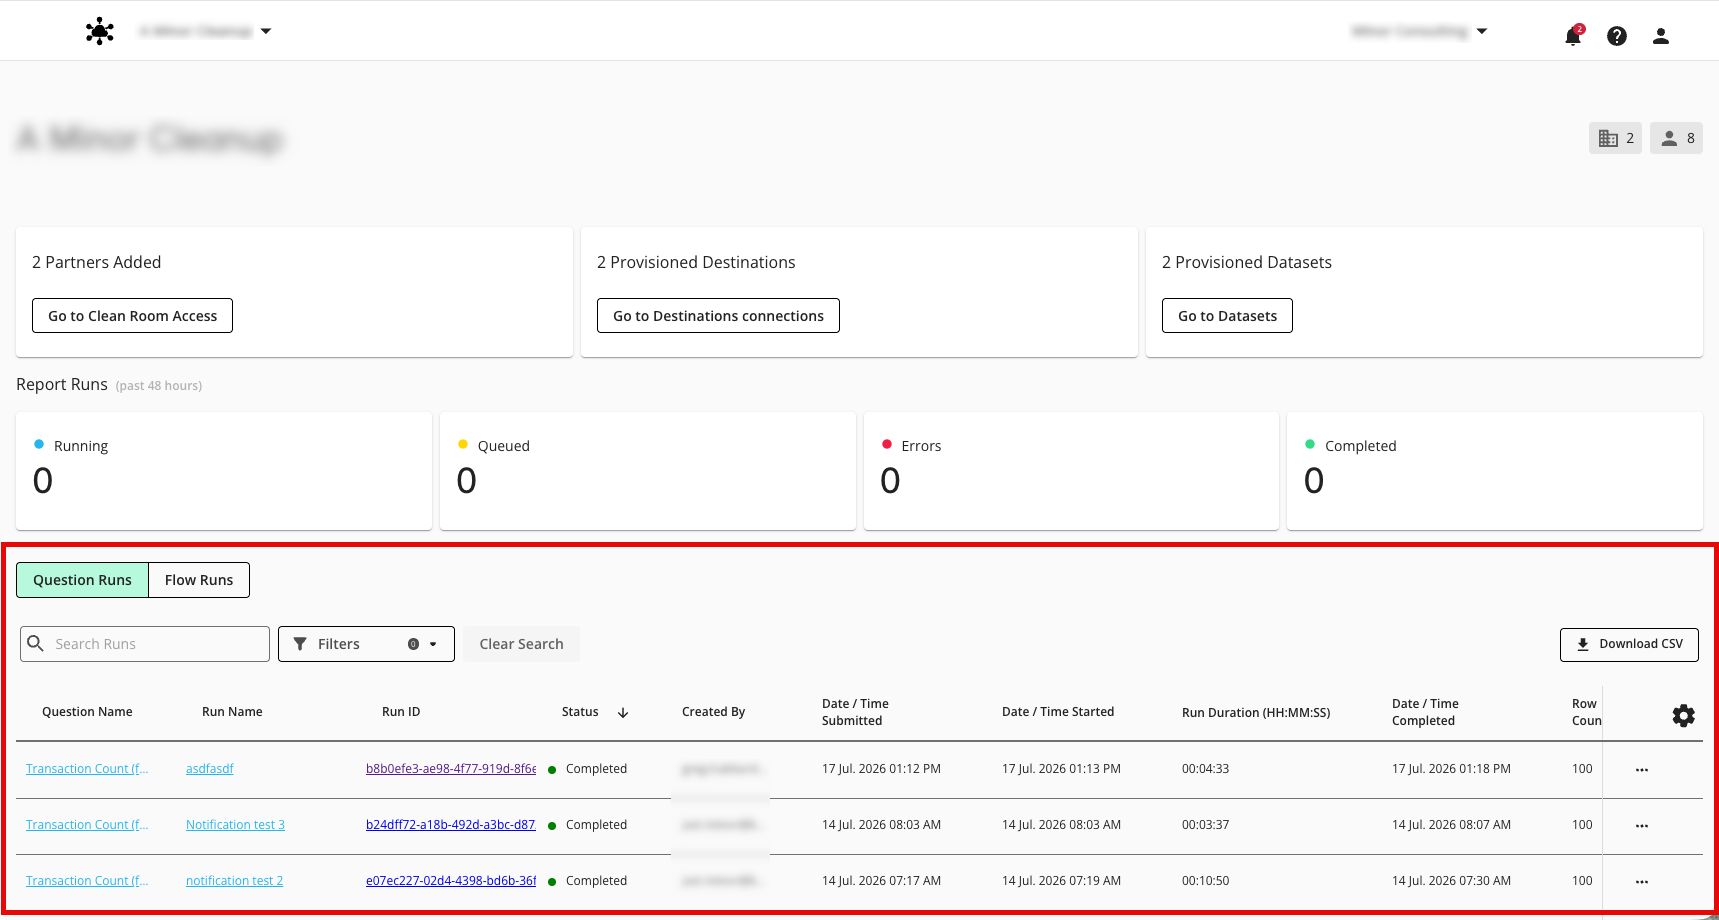
Select the appropriate tab, depending on the type of information you want to view:
Question runs
Flow runs
The table shows the following information:
Note
If you do not have View Reports permission, you might not see all this information and these features.
Name: The question or flow name (if presented as a link, click on the name link to be taken to the Question Runs or Flow Runs page to see all runs for that question or flow)
Run name: The name of the run (if presented as a link, click the run name to open a side panel with additional details on the run, including the CRQ ID)
Run ID: The run ID (if presented as a link, click the run ID to go to the Question Runs page or Flow Runs page for that run)
Status: THe run status (queued, running, completed, or failed)
Created By: The email address of the person who created the run
Date / Time Submitted: When the run was submitted
Date / Time Started: When the run started
Run Duration (HH:MM:SS): How long the run took, which includes queueing time, data preparation, processing, and report generation
Date / Time Completed: When the run completed
Warehouse Size: The warehouse size (for flow runs only)
Row Count: The number of rows processed in the run (question runs only)
You can use the search bar to search by run name. You can also use the filter dropdown to filter by run status and by time period (last 7, 30, or 90 days). Click Clear Search to quickly clear any search criteria and filters.
You can also download the current table view by clicking .
For instructions on changing the table display (including additional sorting options), see “Changing the Table Display”.