Cross-Media Intelligence Workflows
Cross-Media Intelligence (XMI) enables you to create measurement plans, add datasets, and run ad hoc reports.
A measurement plan is essentially a reusable configuration in a LiveRamp clean room that defines which cross‑media datasets (audiences, conversions, exposures, and samples) should be connected, and how the results should be reported.
A typical XMI query runs across at least 15 different clean room assets and 5-15 distinct nodes, depending on the number of first-party assets and direct publisher sources, as illustrated in the following example:
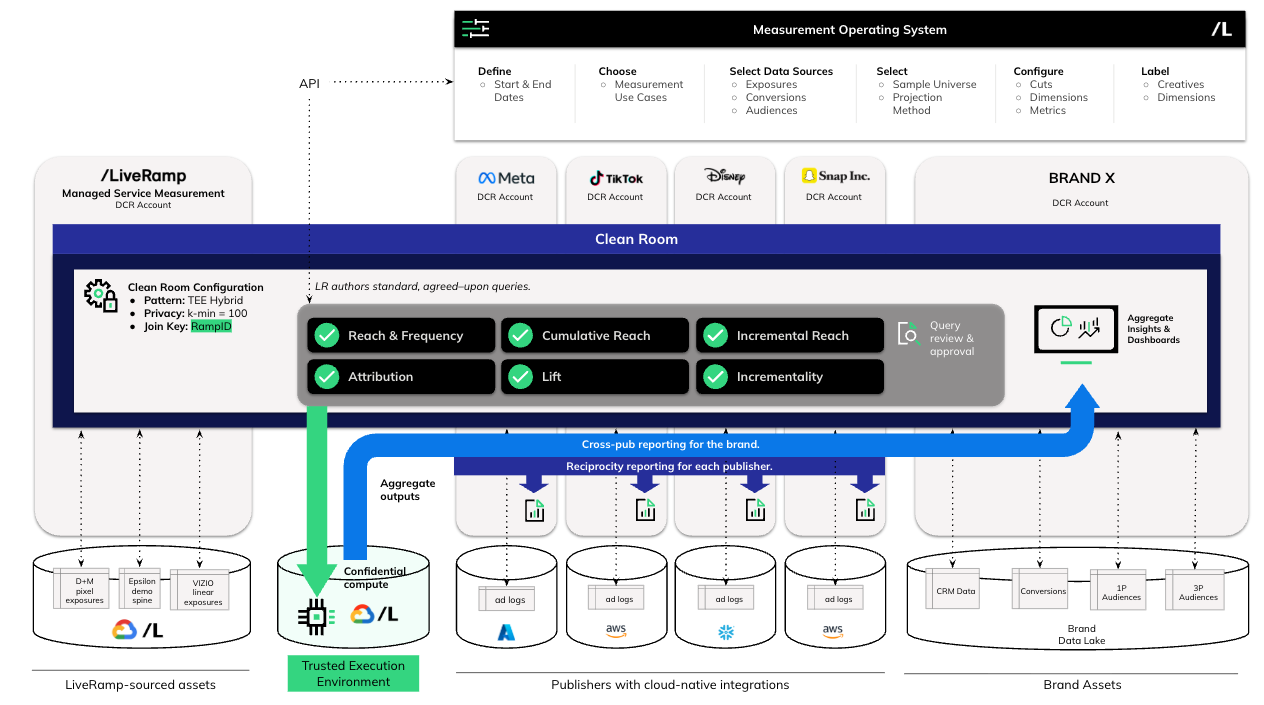
LiveRamp orchestrates all of the actions needed to prepare assets for measurement, unify metadata across publisher sources for insights, QA inputs to ensure quality, run jobs, and outputs.
View a Measurement Plan
If your organization has an existing measurement plan, you can open its details page to view its exposure dimensions and reports, configure its reports, and map its exposure data values.
From the left-hand navigation, select . The Measurement page displays your organization's clean rooms.
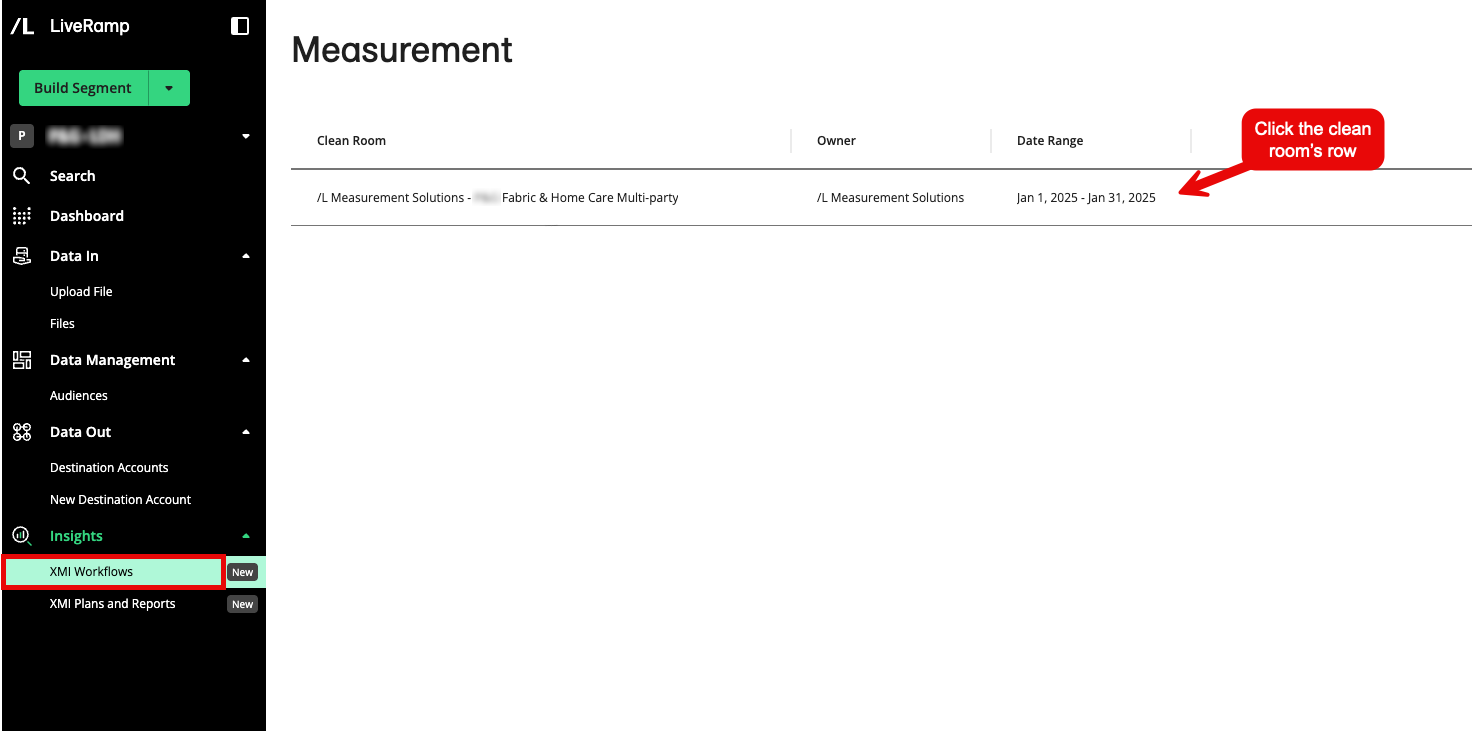
Click the row for the clean room in which you want to create a workflow. The clean room's page displays any existing measurement plans as well as the sources (exposures and audiences) that have been permissioned to this clean room.
From the More Options menu (the three dots), select View Details.
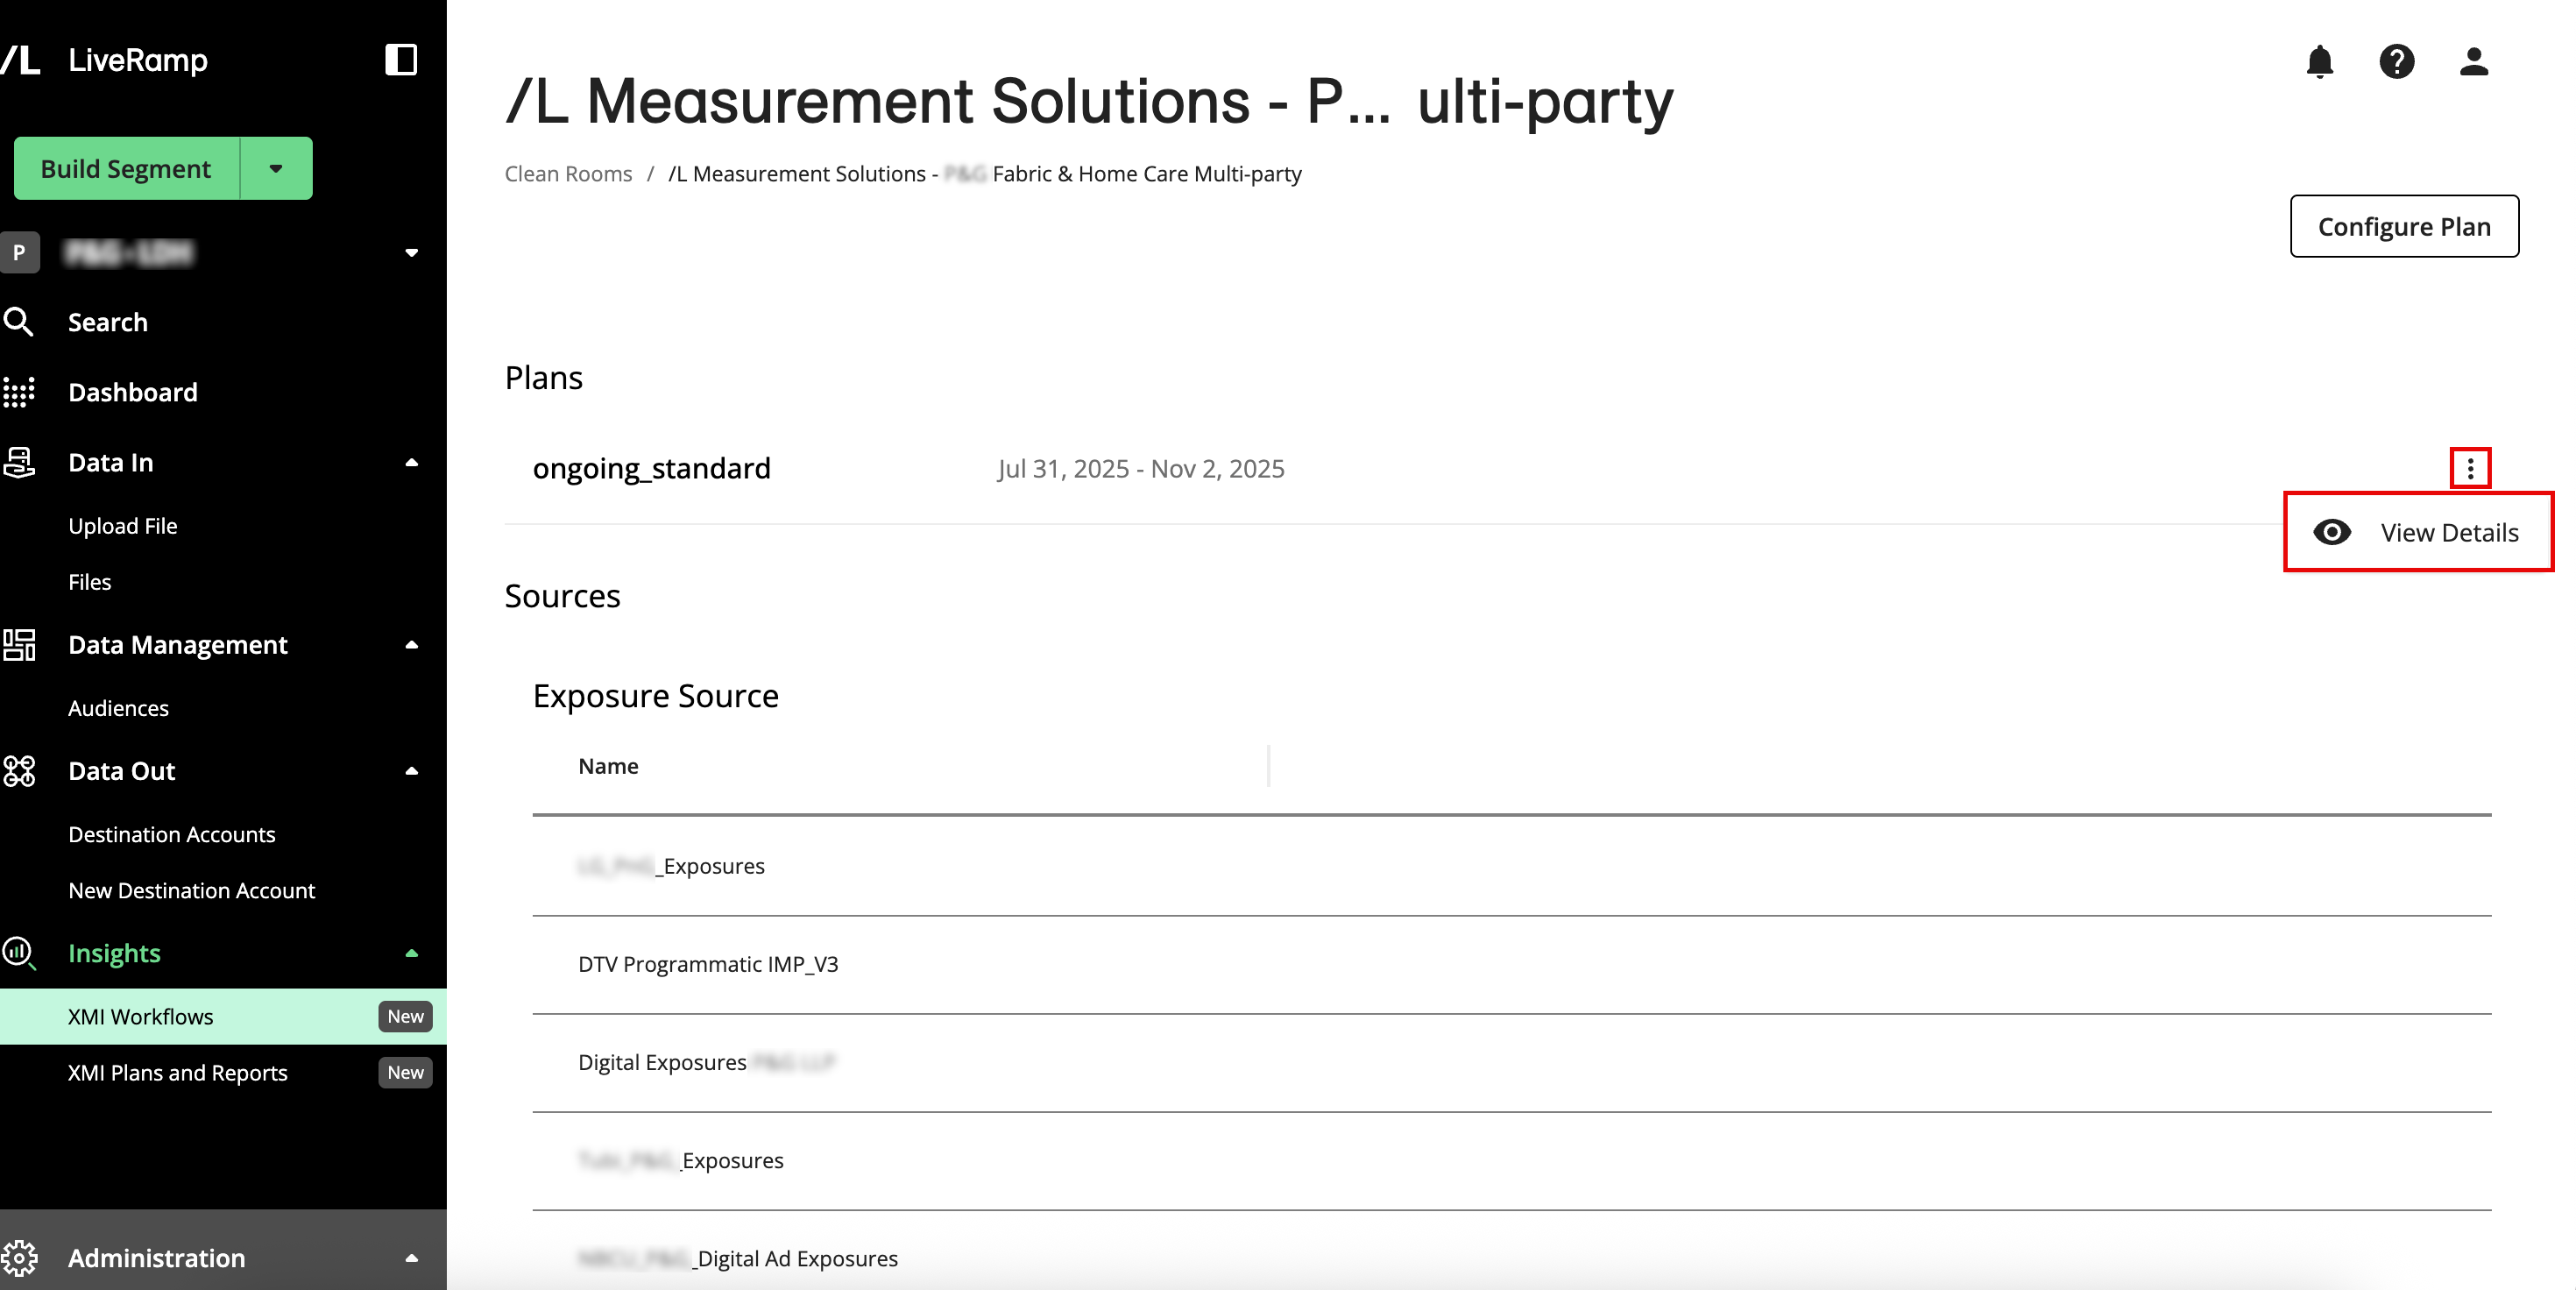
Your measurement plan page displays all your exposure sources and the mappings associated with each of them.
Configure a Report
Your LiveRamp implementation team will create standard reports for your initial measurement plans. You can then use the measurement plan UI to adjust your report configuration as needed. You can also configure a new report for a new measurement plan. For more information about reports, see "XMI Reports".
Open your measurement plan.
Click . The Create Measurement Report page displays the following details:
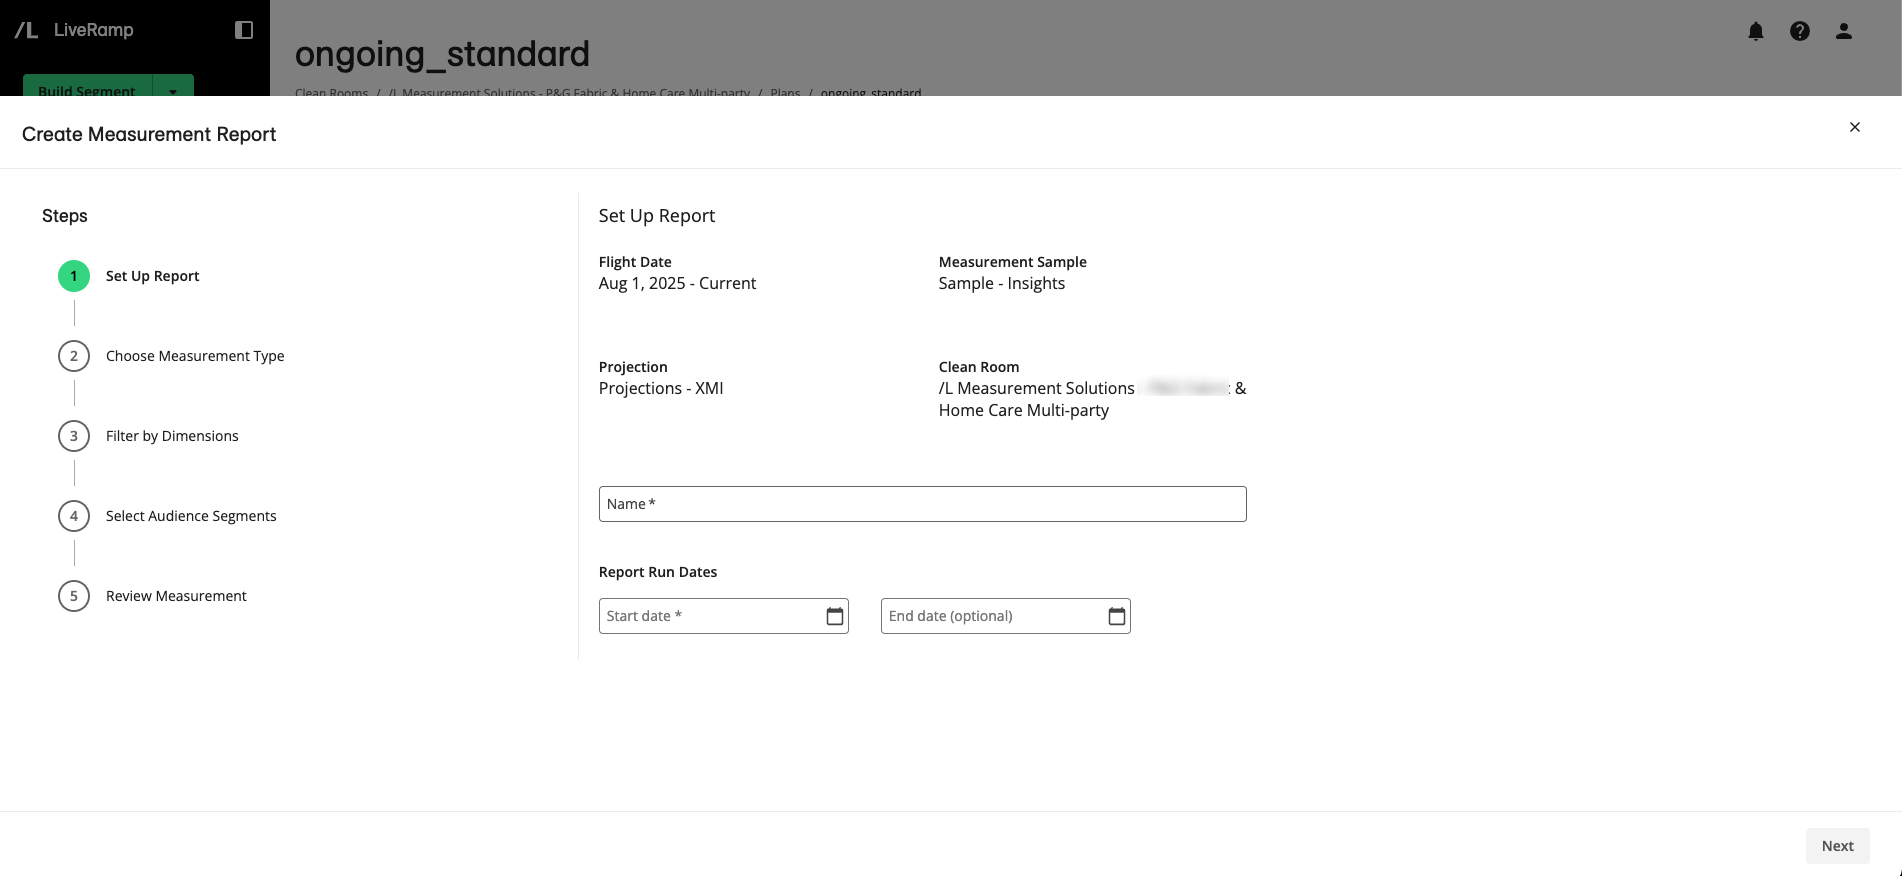
Flight dates: The earliest date supported by the measurement plan to the present
Measurement Sample: The name of the sample selected for this measurement plan, which is typically a standard LiveRamp sample
Projection: The name of the projection selected for this measurement plan
Clean Room: The current clean room that includes the measurement plan
Name: The name of the current or new measurement report
Report Run Dates: The start and end dates of measurement report runs, which must be within the flight window. Omitting an end date can result in ongoing, open-ended data collection and confusion about which data is included in a report.
Note
Recommendation: Limit runs to no more than 30 days.
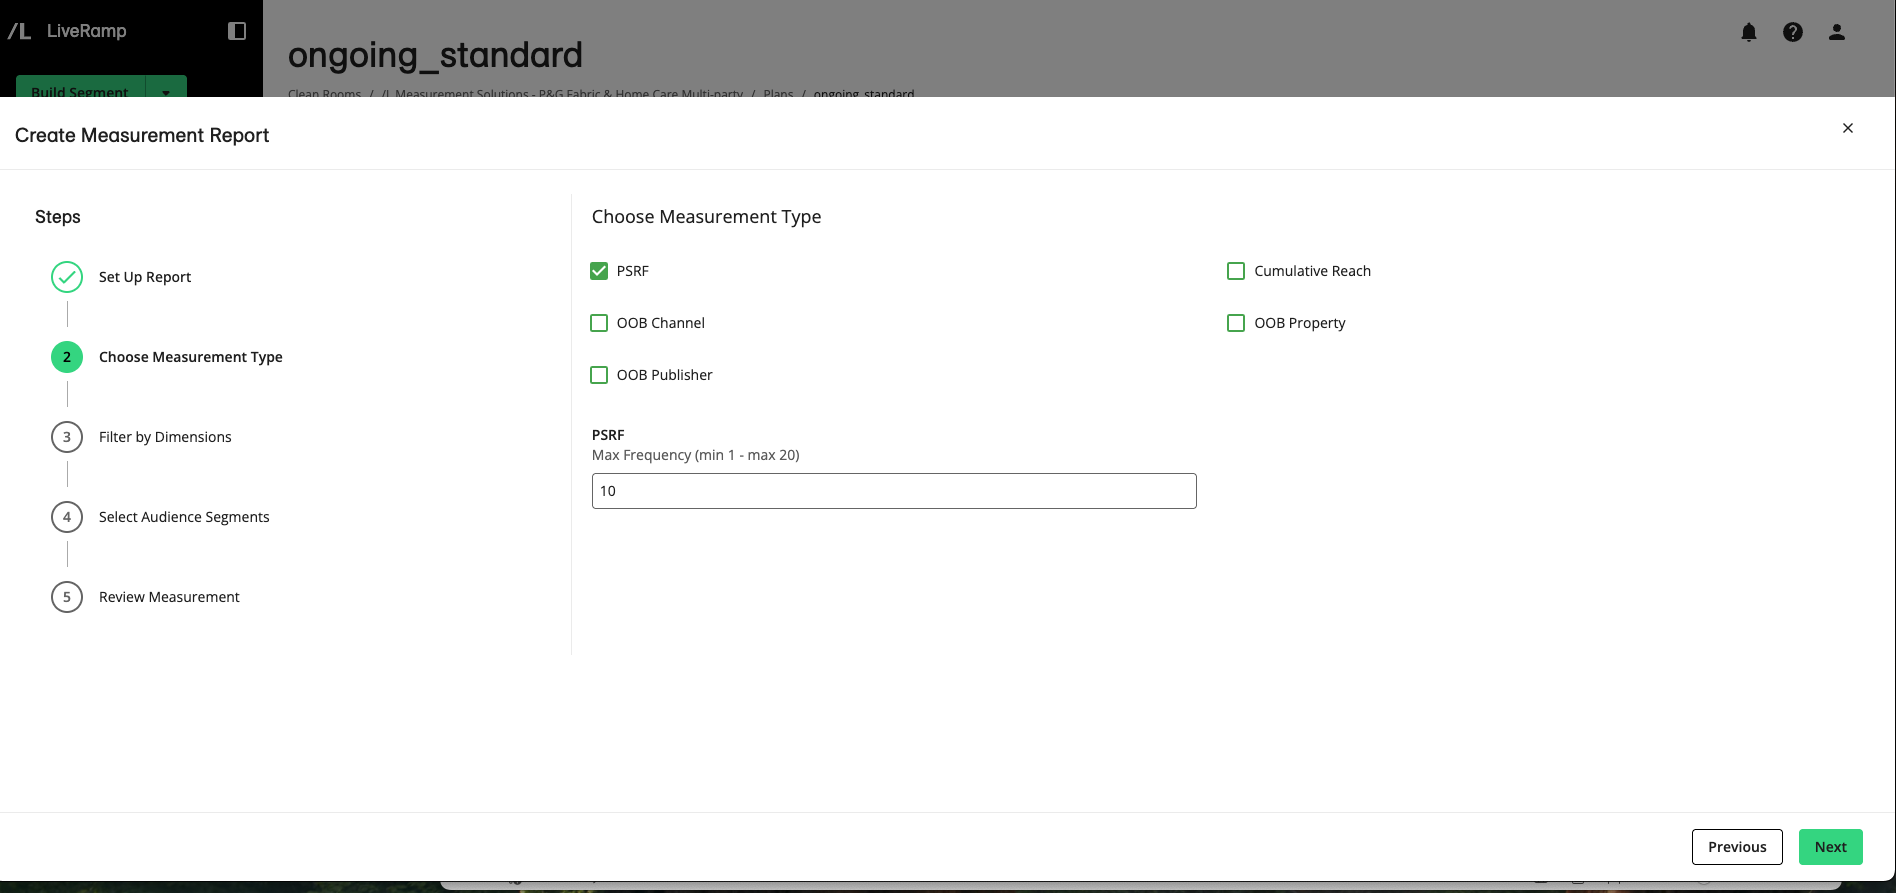
Click . The Choose Measurement Type step displays the following analytics options. When you select an option, a box displays the default value, which you can adjust.
PSRF: Displays a numeric field for a Maximum Frequency value to use with the Projected Scaled Reach Frequency measurement. The default value of 10 indicates that the report will calculate the number of people who saw an ad 1, 2, 3, 4, 5, 6, 7, 8, 9, and 10 times. Any users who saw an ad more than 10 times will be included in the "10+" frequency metric. The supported range is 1 through 20.
Cumulative Reach: Displays a numeric field for a Maximum Frequency value. Like the PSRF option, the default value is 10, and the supported range is 1 through 20.
OOB Channel: Displays a numeric Cardinality field that sets how many distinct channels to include in the Only-Only-Both (OOB) comparison. The default value for this field is 3, which indicates that 3 channels will be analyzed to determine the incremental and overlapping reach. The supported range is 2–5.
OOB Property: Displays a numeric Cardinality field that sets how many distinct properties to compare at once. The default value of this field is 3, and the supported range is 2–5.
OOB Publisher: Displays a numeric Cardinality field that sets how many distinct publisher values to compare at once. The default value of this field is 3, and the supported range is 2–5.
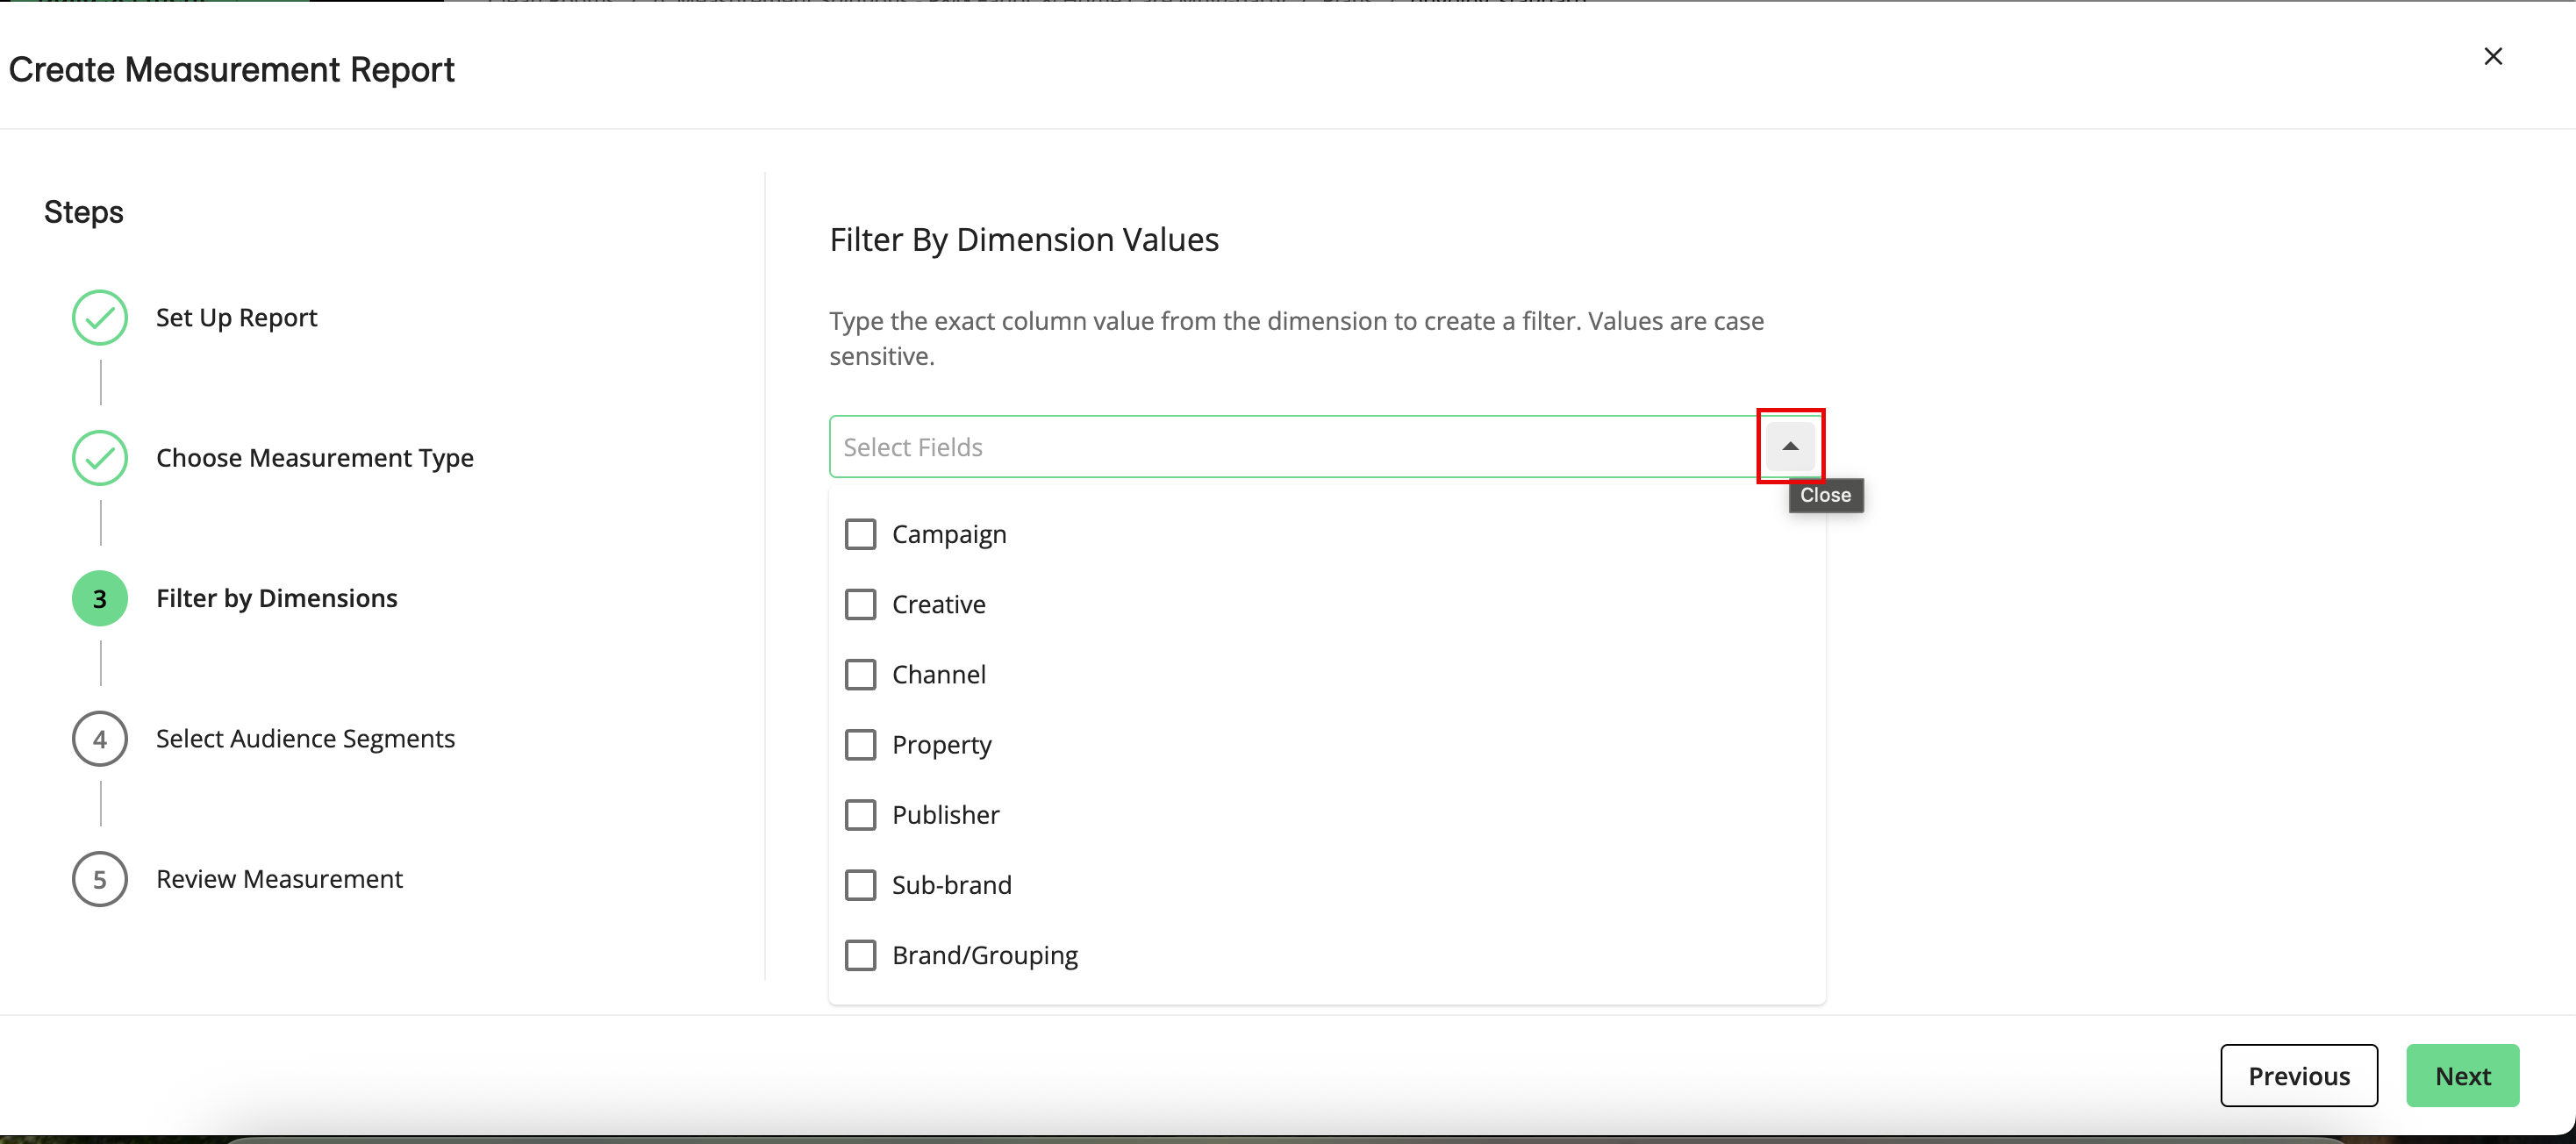
Click . The Filter by Dimensions step displays the following options, which enable you to run reports on a subset of data to reduce job processing time and compute resources:
Campaign: The specific campaign ID for the brand to show report outputs grouped by campaign (such as reach, frequency, impressions, and other selected measurement types displayed per campaign ID for the chosen interval)
Creative: The creative asset or placement identifier (such as creative name or ID). Selecting this shows outputs grouped by creative so you can compare performance at the asset level across your selected measurement types.
Channel: The media channel (such as OLV, CTV, or Social). Selecting this shows outputs grouped by channel, allowing you to view cross-channel totals and channel-level breakouts for your selected measurement types.
Property: The property, site, app, or network where the ad was served. Selecting this option shows outputs grouped by property to analyze performance at the individual property level.
Publisher: The media seller or platform. Selecting this option shows outputs grouped by publisher to understand publisher-level performance for your selected measurement types.
Sub-brand: The brand's product line beneath the primary brand. Selecting this shows outputs grouped by sub-brand.
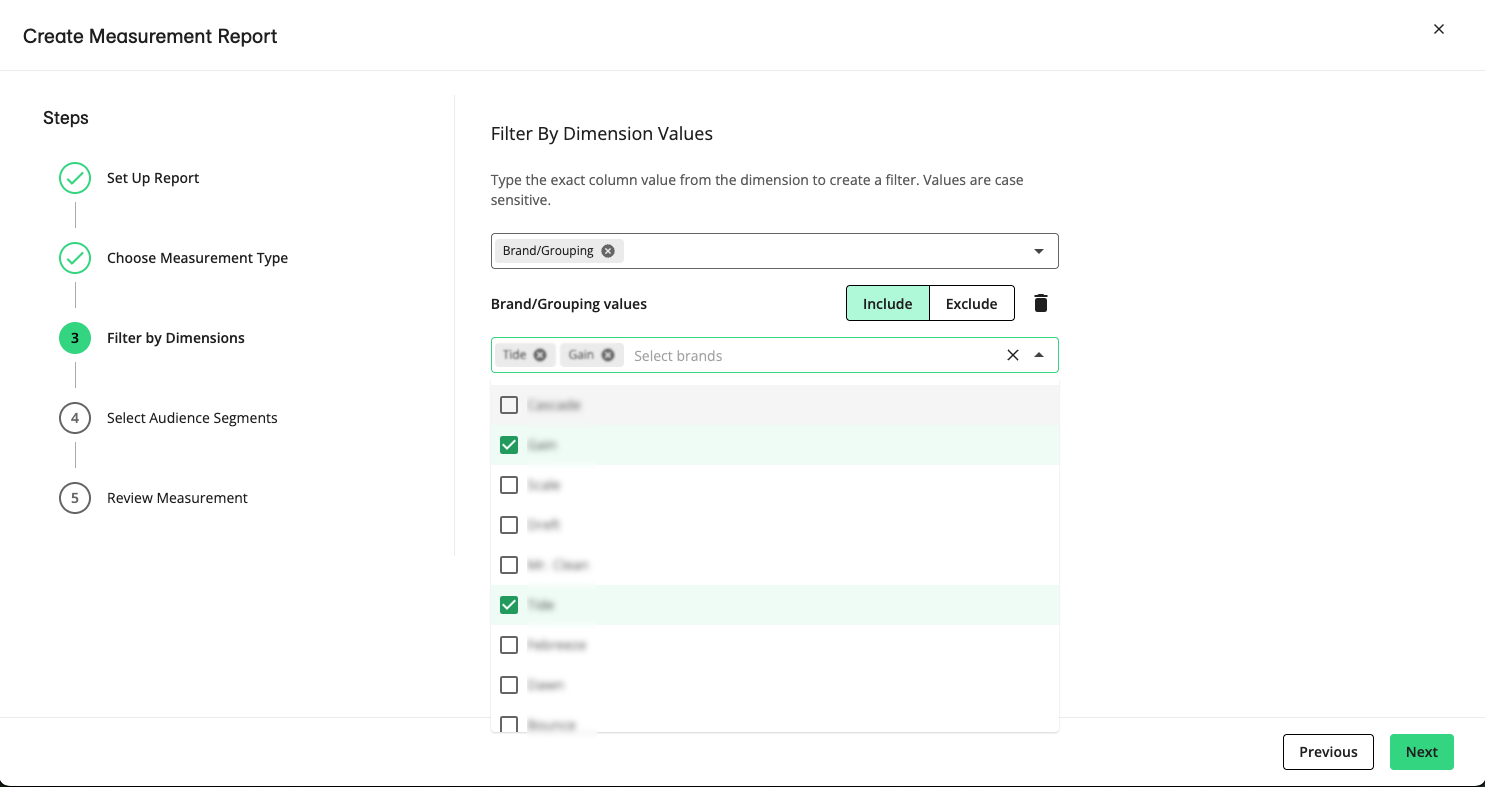
Brand/Grouping: The overall brand-level rollup for the measurement plan (a non-mappable cross-channel total). Selecting this enables you to filter by partition parameters by brand. Selecting the Brand/Grouping option displays a menu of options that you can select to include. If you want to exclude brands, select Exclude. If you select multiple brands, the total report metrics will be a combination of all brands selected, and the sub-brand cut will provide the next level of granularity.
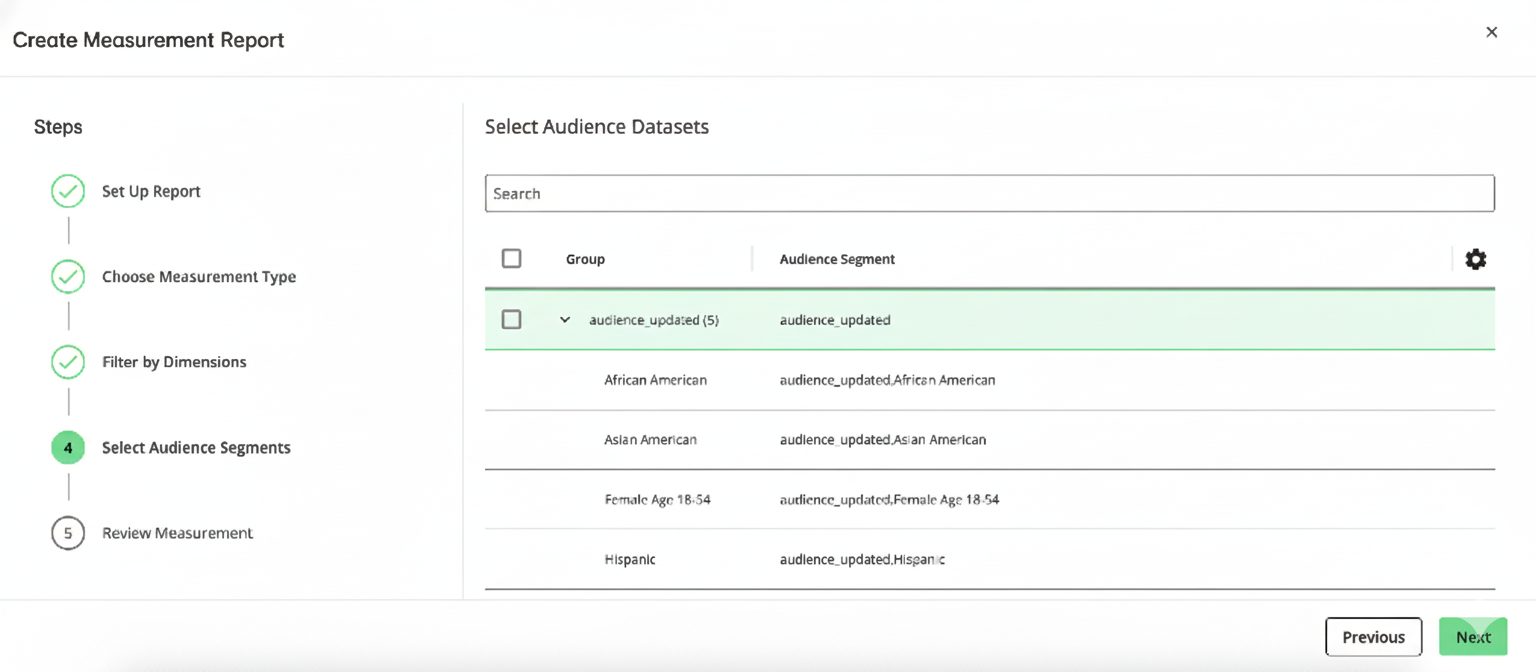
Select your dimension filter options and click . The Select Audience Segments step displays the audience segments you can choose to run your report against.
Select one or more audience segments you want included in your report. If you do not select any options, the report is run on the default All Households audience, which represents all users in the selected campaign.
Click . The Review Measurement step displays report details, such as name, measurement type, dates, measurement sample, projection, and audience segment.
Review your measurement report configuration and then click .
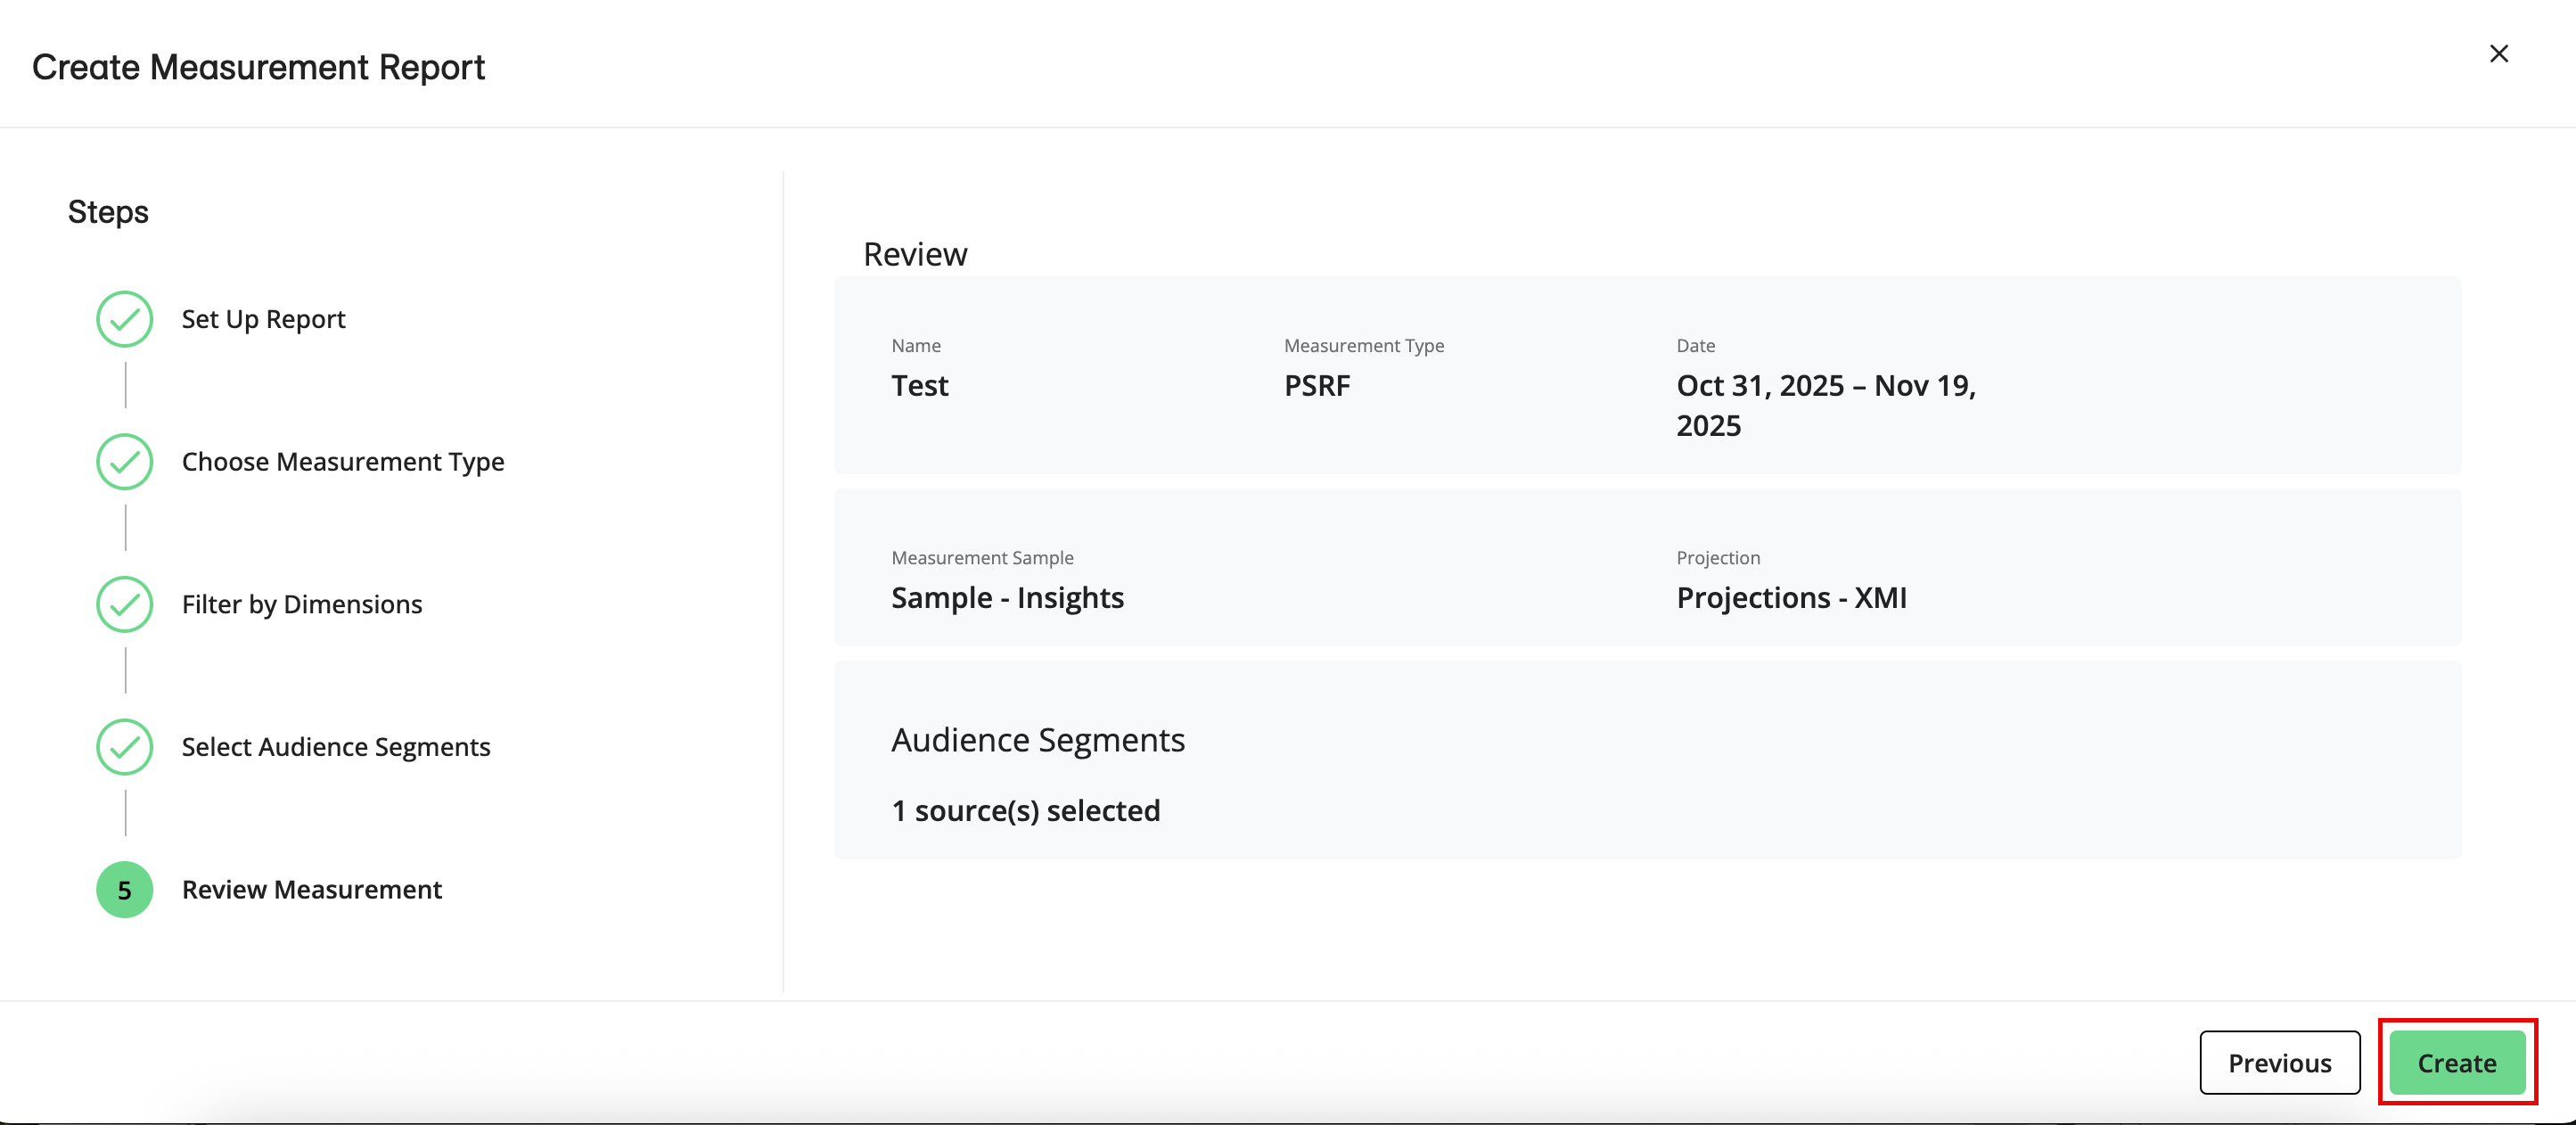
Your measurement report is created.
Input Summary jobs are run to pull in exposure data from the sources and cuts that you specified. This could take a few hours to complete.
The input summaries are updated for the full month that your report is scheduled to run in. Exposure counts are pulled in for each of the corresponding IDs in your maps, allowing you to perform QA when value mapping and prioritizing fields with the most exposures.
Value Mapping
If value mapping is enabled for your organization, you can perform value mapping to define parameters for measurements and customize report outputs. This also enables you to perform quality assurance (QA) before running your newly configured reports.
You can use the Value Mapping App to map raw exposure data (such as placement, creative, channel, publisher, or property IDs) into standardized, human-readable groups for reporting and analysis. This helps your reports to display accurate, consistent measurement outputs and enables deduplication.
Open your measurement plan.
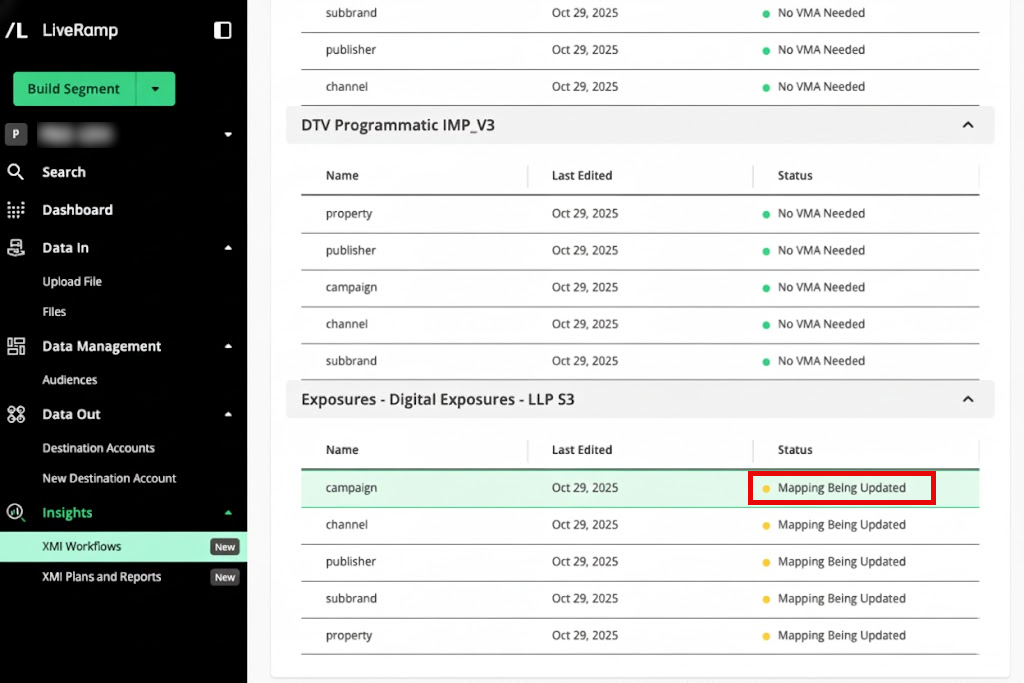
To open the Value Mapping App, click on any of the rows with the "Ready for Mapping Review" status. Your exposures dataset mapping page displays a large number of columns and rows, each representing different attributes or records from the exposure data.
Note
Currently, you can only map and update the "Exposures- Digital Exposures - LLP S3" dataset.
Sort and filter the table to focus on specific columns (such as campaign, channel, or creative) to find unmapped or incorrectly mapped records. This enables you to review, update, and validate your mappings before finalizing your reporting.
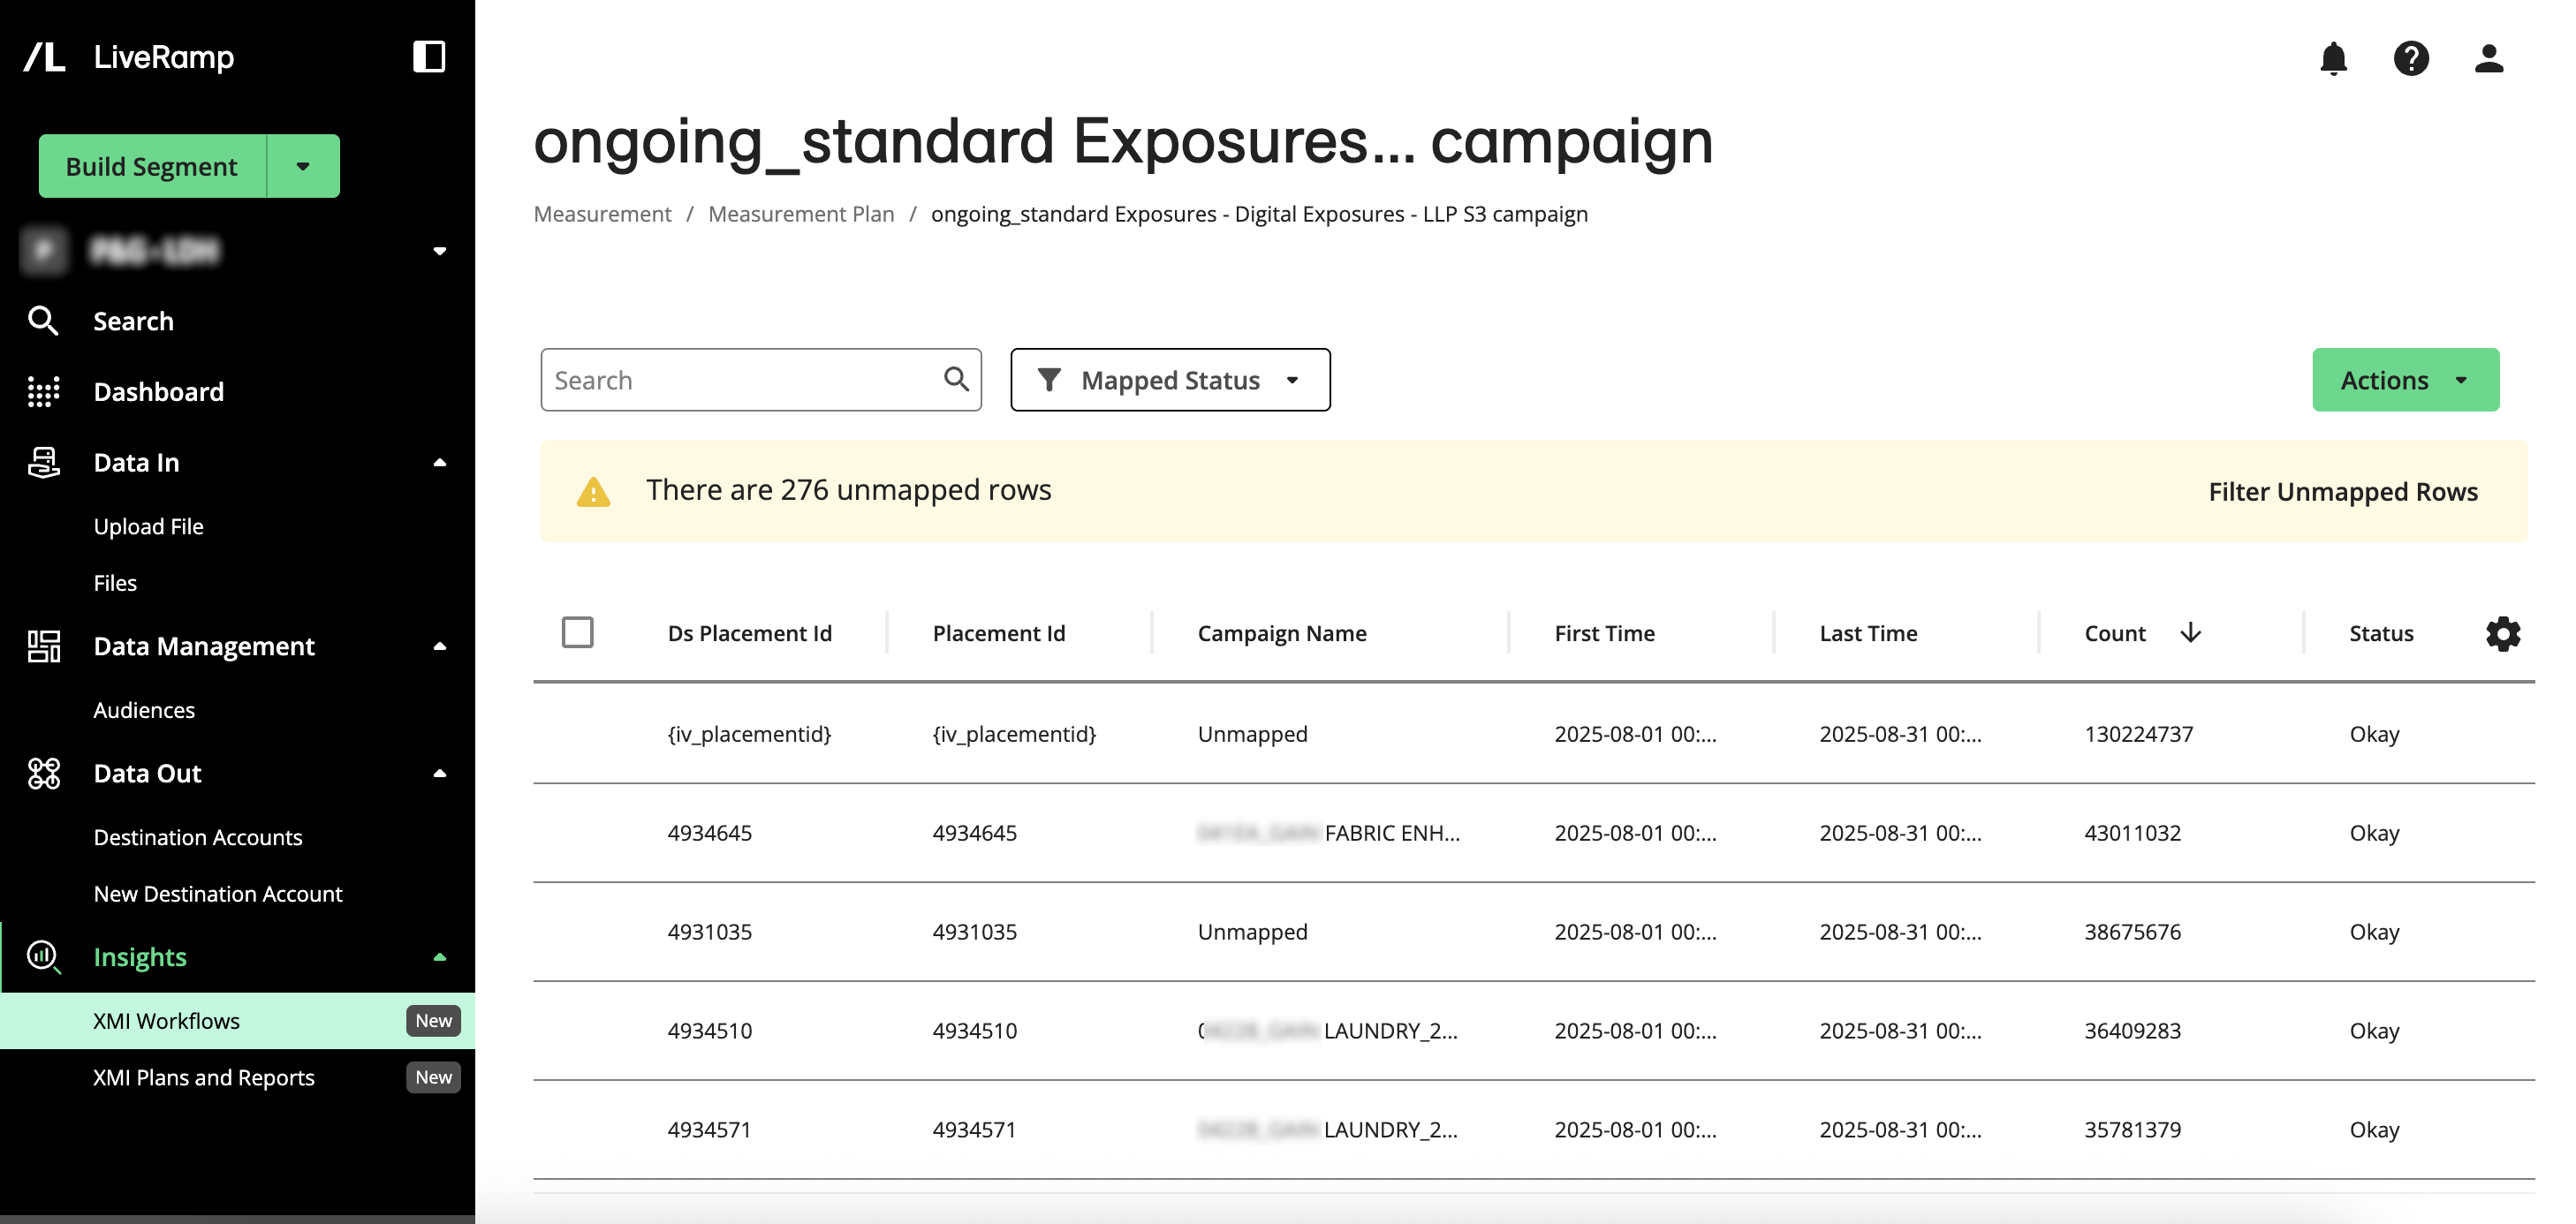
To see the fields that are unmapped, click Filter Unmapped Rows.
Value Mapping Columns and Stauses
The column names in the Value Mapping App vary based on your datasets, but their sequential order typically indicates the following:
Column 1: The source ID from the exposure data that is used to match to the exposure data and to pull in exposure counts
Column 2: Provides the corresponding ID from the mapping files, which serves as a reference for matching IDs from the mapping files (which are either uploaded or carried over) to the source IDs found in the exposure data (the first column). This dual-column approach is important for troubleshooting and reconciliation.
Column 3: Provides the name that you want to see in your report. To edit an individual row, click in and edit the text in the row, and the map is automatically updated.
First Time column: The first time the ID was seen in the mapping file for the specified time range.
Last Time column: The most recent time the ID was seen in the mapping file for the specified time range.
Count column: The exposure counts in household RampIDs observed in the raw data received from the publisher or pixel associated with the raw mapping ID. This count is joined to the map to allow for some QA as well as prioritization of mapping fields, so ensure users are spending time mapping their most impactful IDs.
Status column: Supported values include:
Mapping Being Updated: Input summaries are yet to be run.
Mapping Update Failed: When attempting to update the mapping after the input summaries were run, something went wrong.
Input Summary Question Failed: The clean room question run failed.
Input Summary Question ID Needed: The input summary question ID for the measurement plan was not specified
Mapping Needs to Be Created: Mapping has not yet been defined in the Value Mapping App.
No VMA Needed: When no report has been created, this is the default value.
Running Input Summary Question: The clean room question is still running
Unknown Failure: This is the default error status if the report status is not yet known.
Ready for Mapping Review: This status indicates that Value Mapping App work can be performed.
Running Reach and Frequency Reports
After you build your measurement plan and before running your Reach and Frequency report, you should perform a QA run to verify that you have the right configuration before starting a multi-hour report run. It's also a good idea to evaluate what is included in its output to ensure that the full report will meet your expectations
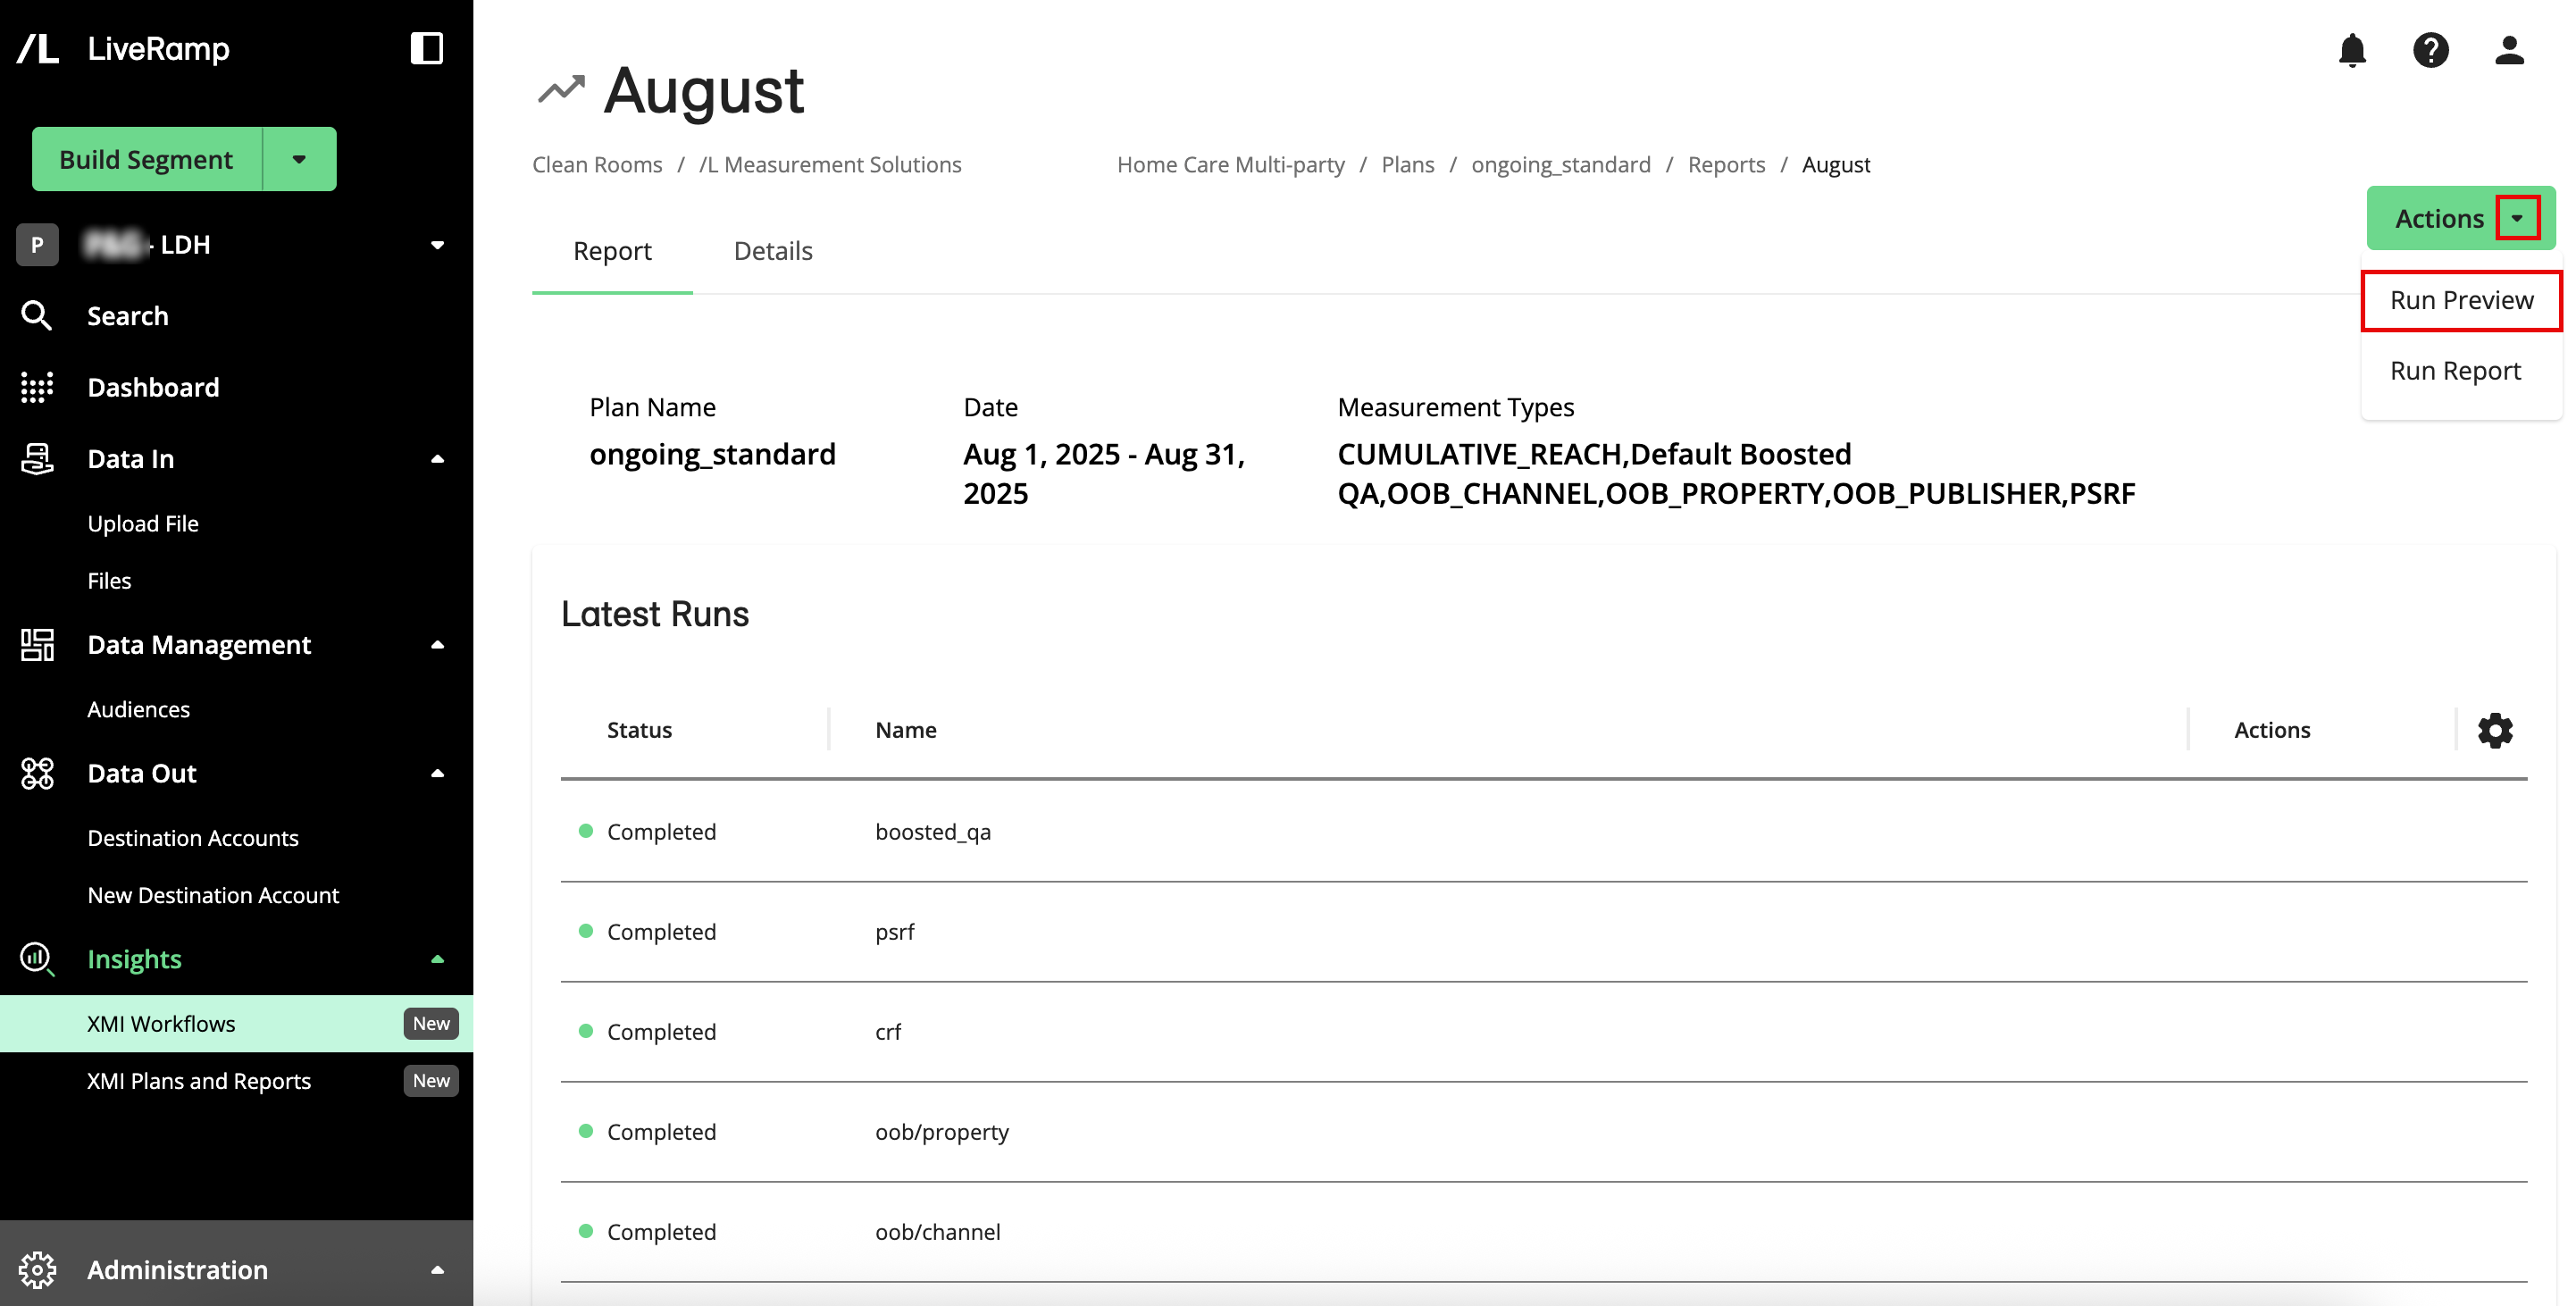
Open the measurement plan that you want to run: XMI Workflows → select the plan's clean room → select the plan. Any previous report runs are displayed.
For a QA run, click → Run Preview.
The QA run begins, and the following statuses are displayed next to the run as applicable:
About to Run
Completed
Failed
Failed to Start
Not Started
Queued
Running
Unknown
The QA run should complete within 1-2 hours and will be visible in the corresponding clean room.
Open the measurement plan that you want to run: XMI Workflows → select the plan's clean room → select the plan. Any previous report runs are displayed.
Click → Run Report.
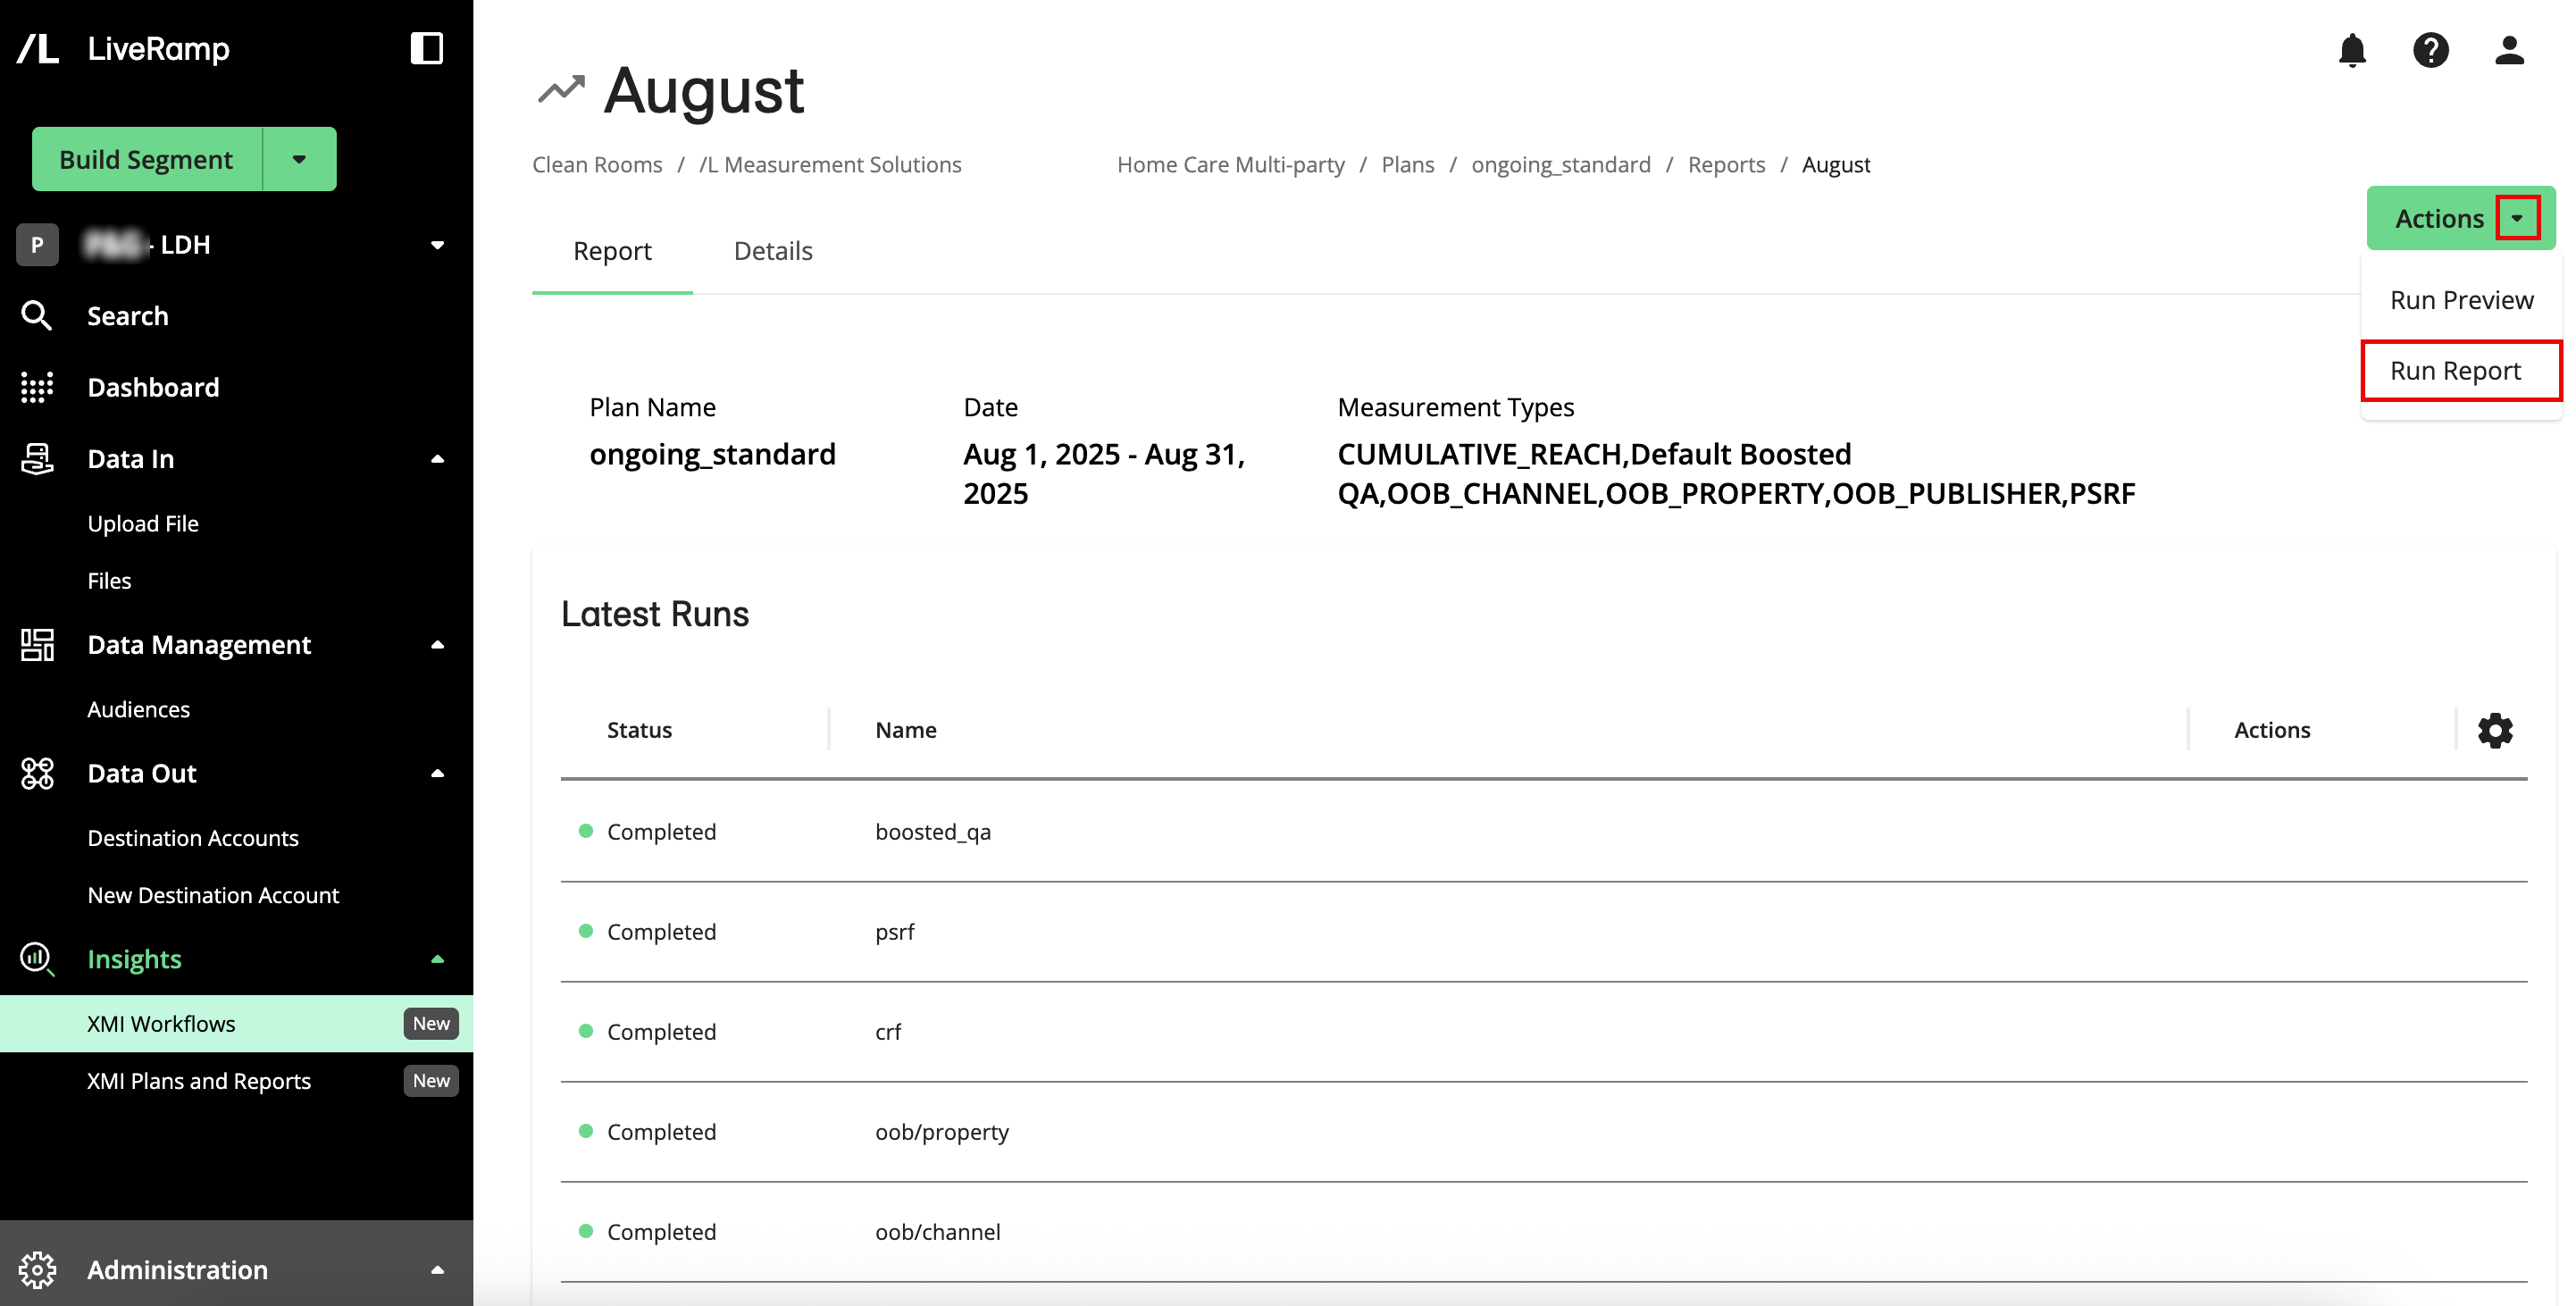
The run begins, and various statuses are displayed next to the run.
Depending on its configuration, a report run can take in excess of 12 hours. When it completes, it will be visible in the corresponding clean room.
Standard Cut Definitions
The following standard cut types are used for the supported reports. You can assign them during the value mapping process.
The goal of this cut hierarchy is to provide a consistent framework for LiveRamp's XMI models to consume your inputs. You can define each field based on how your media buys are structured and map these fields as needed for your use cases. You can use all of the fields or just a subset. The examples are suggestions to illustrate how you can populate each field, not strict requirements.
Creative and Campaign Cuts
Following this cut hierarchy, which is used consistently across XMI reports, helps you to compare performance consistently across brands and campaigns.
Field | Description | Mappable? | Examples |
|---|---|---|---|
Brand | The primary report cut, which provides the overall, cross-channel view of the data | No |
|
Sub-brand | Useful for grouping campaign IDs into themes and sub-brands | Yes |
|
Campaign | A customizable field that you can define based on how your media buys are structured, which is useful for defining measurement tactics based on an aggregation of campaign IDs, placements, creatives, and your reporting needs | Yes |
|
Creative | The name of the creative used in reporting | Yes |
|
Channel and Publisher Cuts
The following required fields are essential for model scaling. They are all mappable and must be derived from the same ID as the other fields in this channel-publisher-property hierarchy.
Field | Description | Examples |
|---|---|---|
Channel | The general type of media platform where an ad was served, such as online video (OLV), linear TV, over-the-top (OTT), or full episode player |
|
Channel-Publisher | The owner of the ad space in which the ad was served |
|
Channel-Publisher-Property | The exact location of the ad placement where your ad was served. For TV, property is the TV network where an ad was served within a campaign (such as "ABC" or "ESPN"). For digital, property can be the publisher or a more granular classification of the data, such as "DV360". NoteIf a pixel or a direct publisher lacks a property value, this field will inherit the Channel-Publisher field into the Channel-Publisher-Property field. |
|
For more information, see "XMI Reports".
XMI Workflow FAQs
What counts as the same measurement plan?
Rerunning reports for a different interval, such as monthly, quarterly, or a new date range
Looking at new audience segments or conversion cuts within the same data connections
Updating report modeling configurations, such as their frequency buckets or attribution windows
Updated mapping of the same data connections
When is a new measurement plan required?
If you bring in a different set of audience, conversion, or exposure data connections (e.g., adding a new retailer, publisher, or conversion source)
If you configure measurement for a different brand or business line that has its own distinct data connections
If you make structural changes that require a new audience, conversion, exposure, or sample configuration
If you add a new or custom reporting cut
For more information, see "XMI FAQs".