Overlap Data Assets
To get profiling insights into your data assets, as well as data assets you do not own, you can overlap the first-party data assets in your account to see the percentage and number of members those assets have in common.
Overlapping data assets allows you to understand what your segments are made of, compare them, and make informed decisions on what to activate. Understanding who is in a segment can drive confidence in a campaign, as well as inform the messaging that should be focused on.
For example, you'll be able to profile your data to answer the following types of questions:
"How much reach do I gain if I add this segment to mine?"
"How many of my best customers are in NYC?"
"What's the distribution of my best customers by city, etc.?"
Data You Can Overlap
You can overlap the following first-party data asset types:
Segments (including segments you've built using the Segment Builder), indicated by the
 icon
iconTables (where you include all members of the table), indicated by the
 icon
iconTable attributes that use a string field, indicated by the
 icon
icon
Note
When selecting a table attribute, only string field attributes can be used. You cannot select attributes of other field types, such as numeric or data.
You can only select your first-party segments and tables that are not in an error or pending status. You cannot select a user-defined function or a segment or table that is an error or pending status to perform an overlap.
Overlap Limitations
Overlaps are subject to the following limitations:
Type of Data | Overlap Data Limitations |
|---|---|
Data from multiple datasets, including the following types:
| Can overlap with data from the following dataset types:
Cannot overlap with online data not based on RampIDs. |
Overlaps cannot be performed when the selected assets include any of the following:
More than 11 assets
Assets that are in an invalid or error status
Tables that are configured as event data
Lookalike segments
Assets from a clean room dataset and assets from a different dataset
Assets from an online dataset not based on RampIDs
Ways to Perform Overlaps
You can access the overlap functionality in two ways:
Access the overlap tool directly: The overlap tool is best suited for quick, on-the-fly overlaps. During the overlap process in the overlap tool, you can also build a segment from any two of the assets you're comparing.
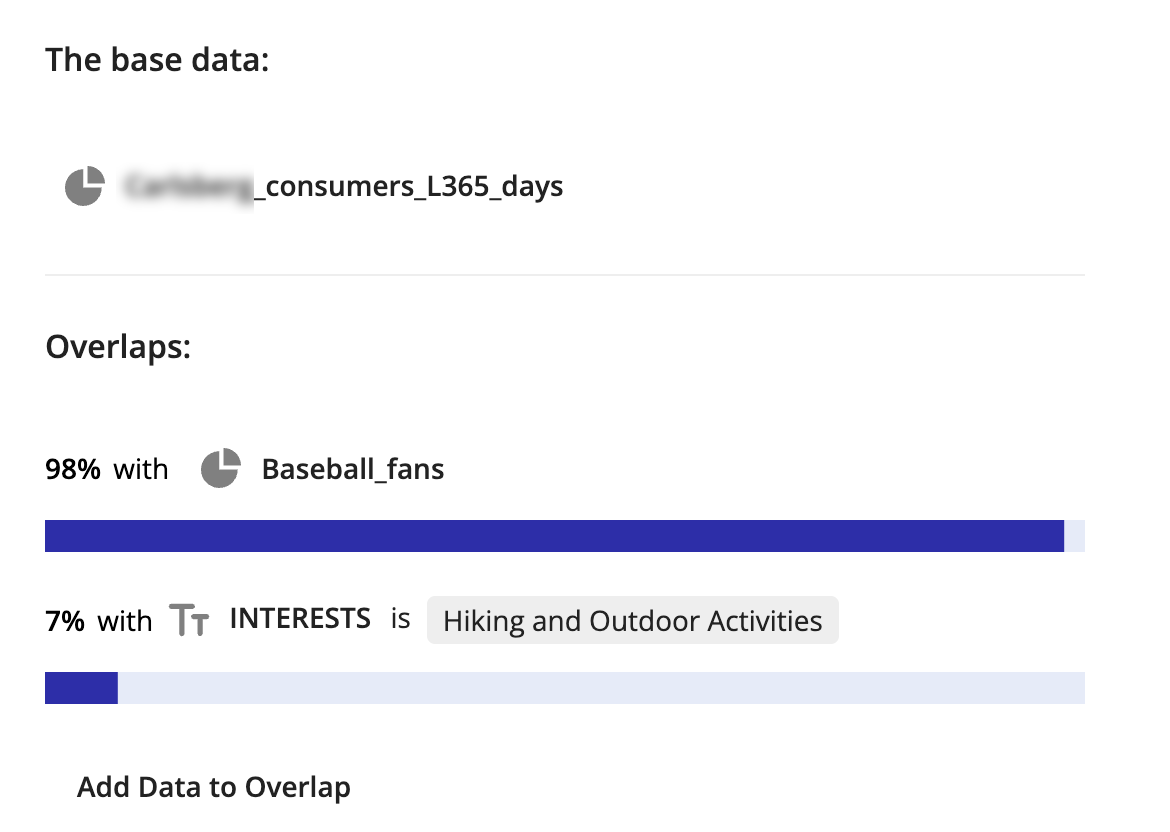
Perform overlaps while building a segment with the Segment Builder: Use the Segment Builder for more complex overlap use cases, as you can create a compound segment to use as the base data. For example, you might want to overlap a base data segment of (people who are baseball fans AND like a certain beer) with overlap data on regions of the country. The Segment Builder is more suited for this type of overlap.
For instructions, see the sections below.
Overlap Data with the Overlap Tool
The overlap tool is best suited for quick, on-the-fly overlaps.
Note
If you have a more complex overlap use case, use the Segment Builder, as you can create a compound segment to use as the base data. For example, you want to overlap (people who are baseball fans AND like a certain beer) with regions. For more information, see the "Overlap Data with the Segment Builder" section below.
To access the overlap tool directly:
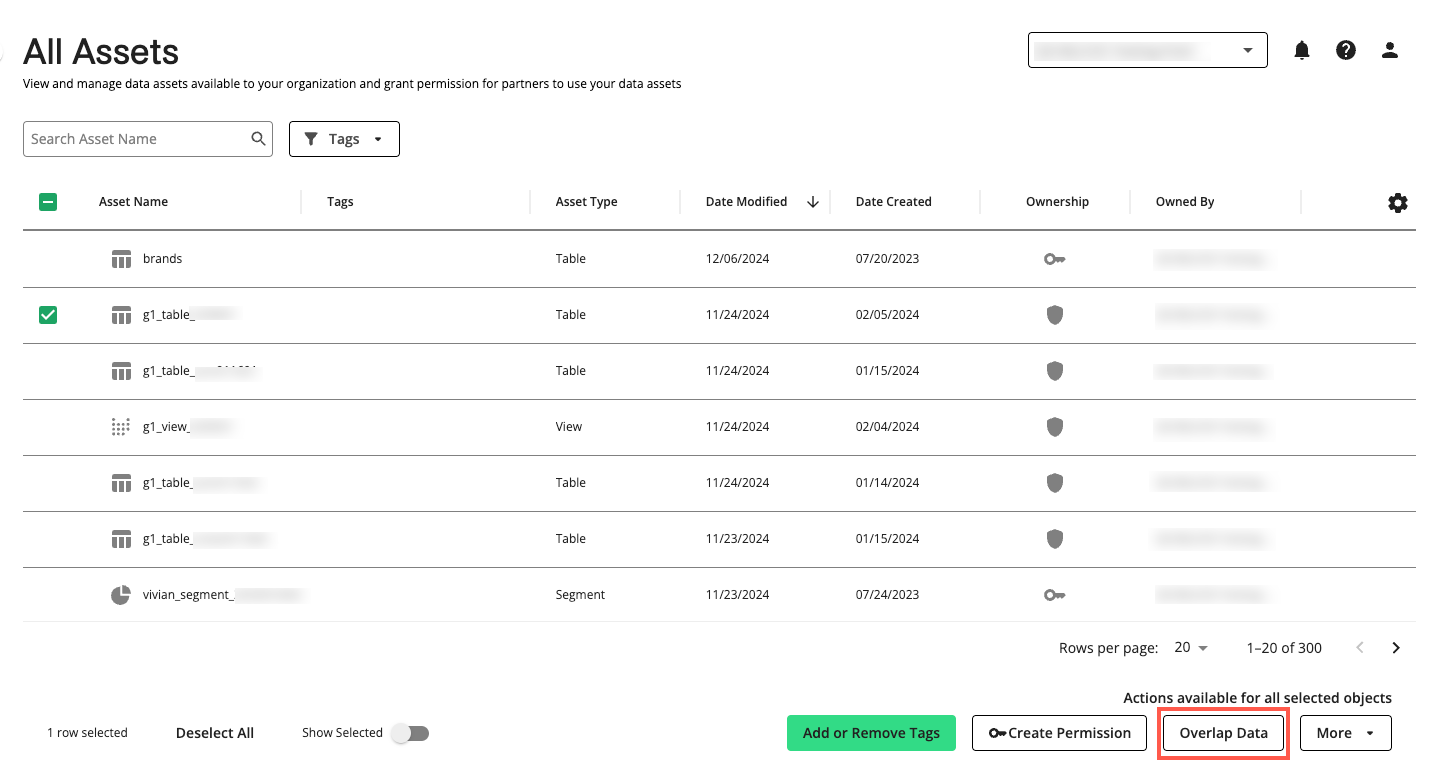
From one of the Data Assets pages (such as the All Assets page or the Segments page), check the check box for one or more assets you want to overlap and then click .
Note
You can only select your first-party segments and tables that are not in an error or pending status. You cannot select a user-defined function or a segment or table that is an error or pending status to perform an overlap.
If you select multiple assets, the first asset will be used as the base data and the other assets will be used as the overlap data.
You cannot select more than 11 total assets.
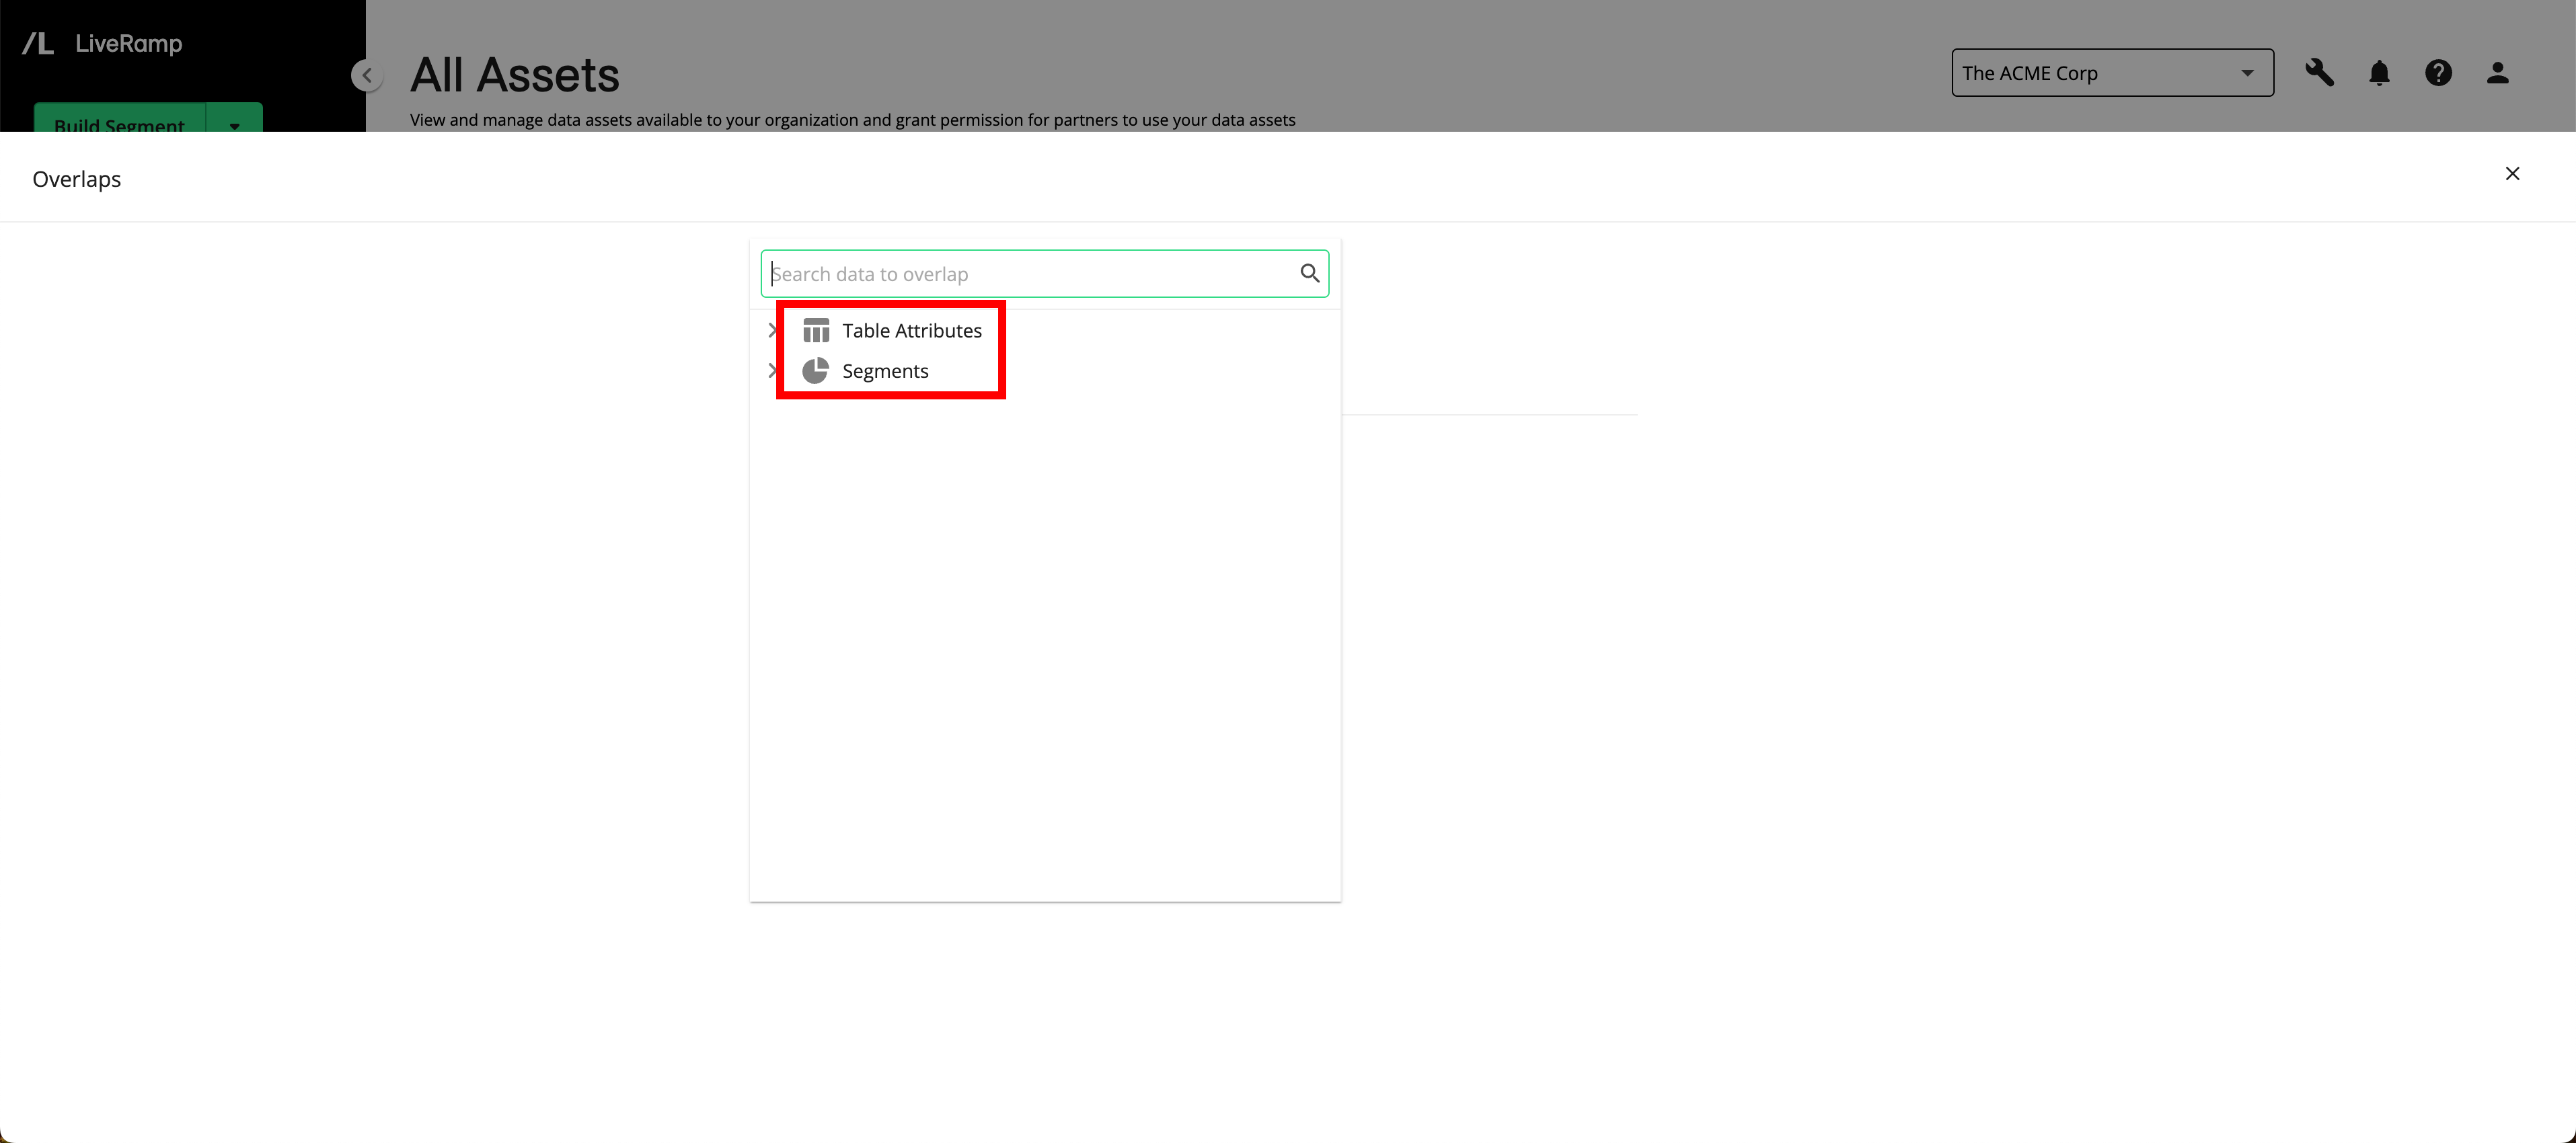
From the Overlaps page, click and then select the desired data asset.
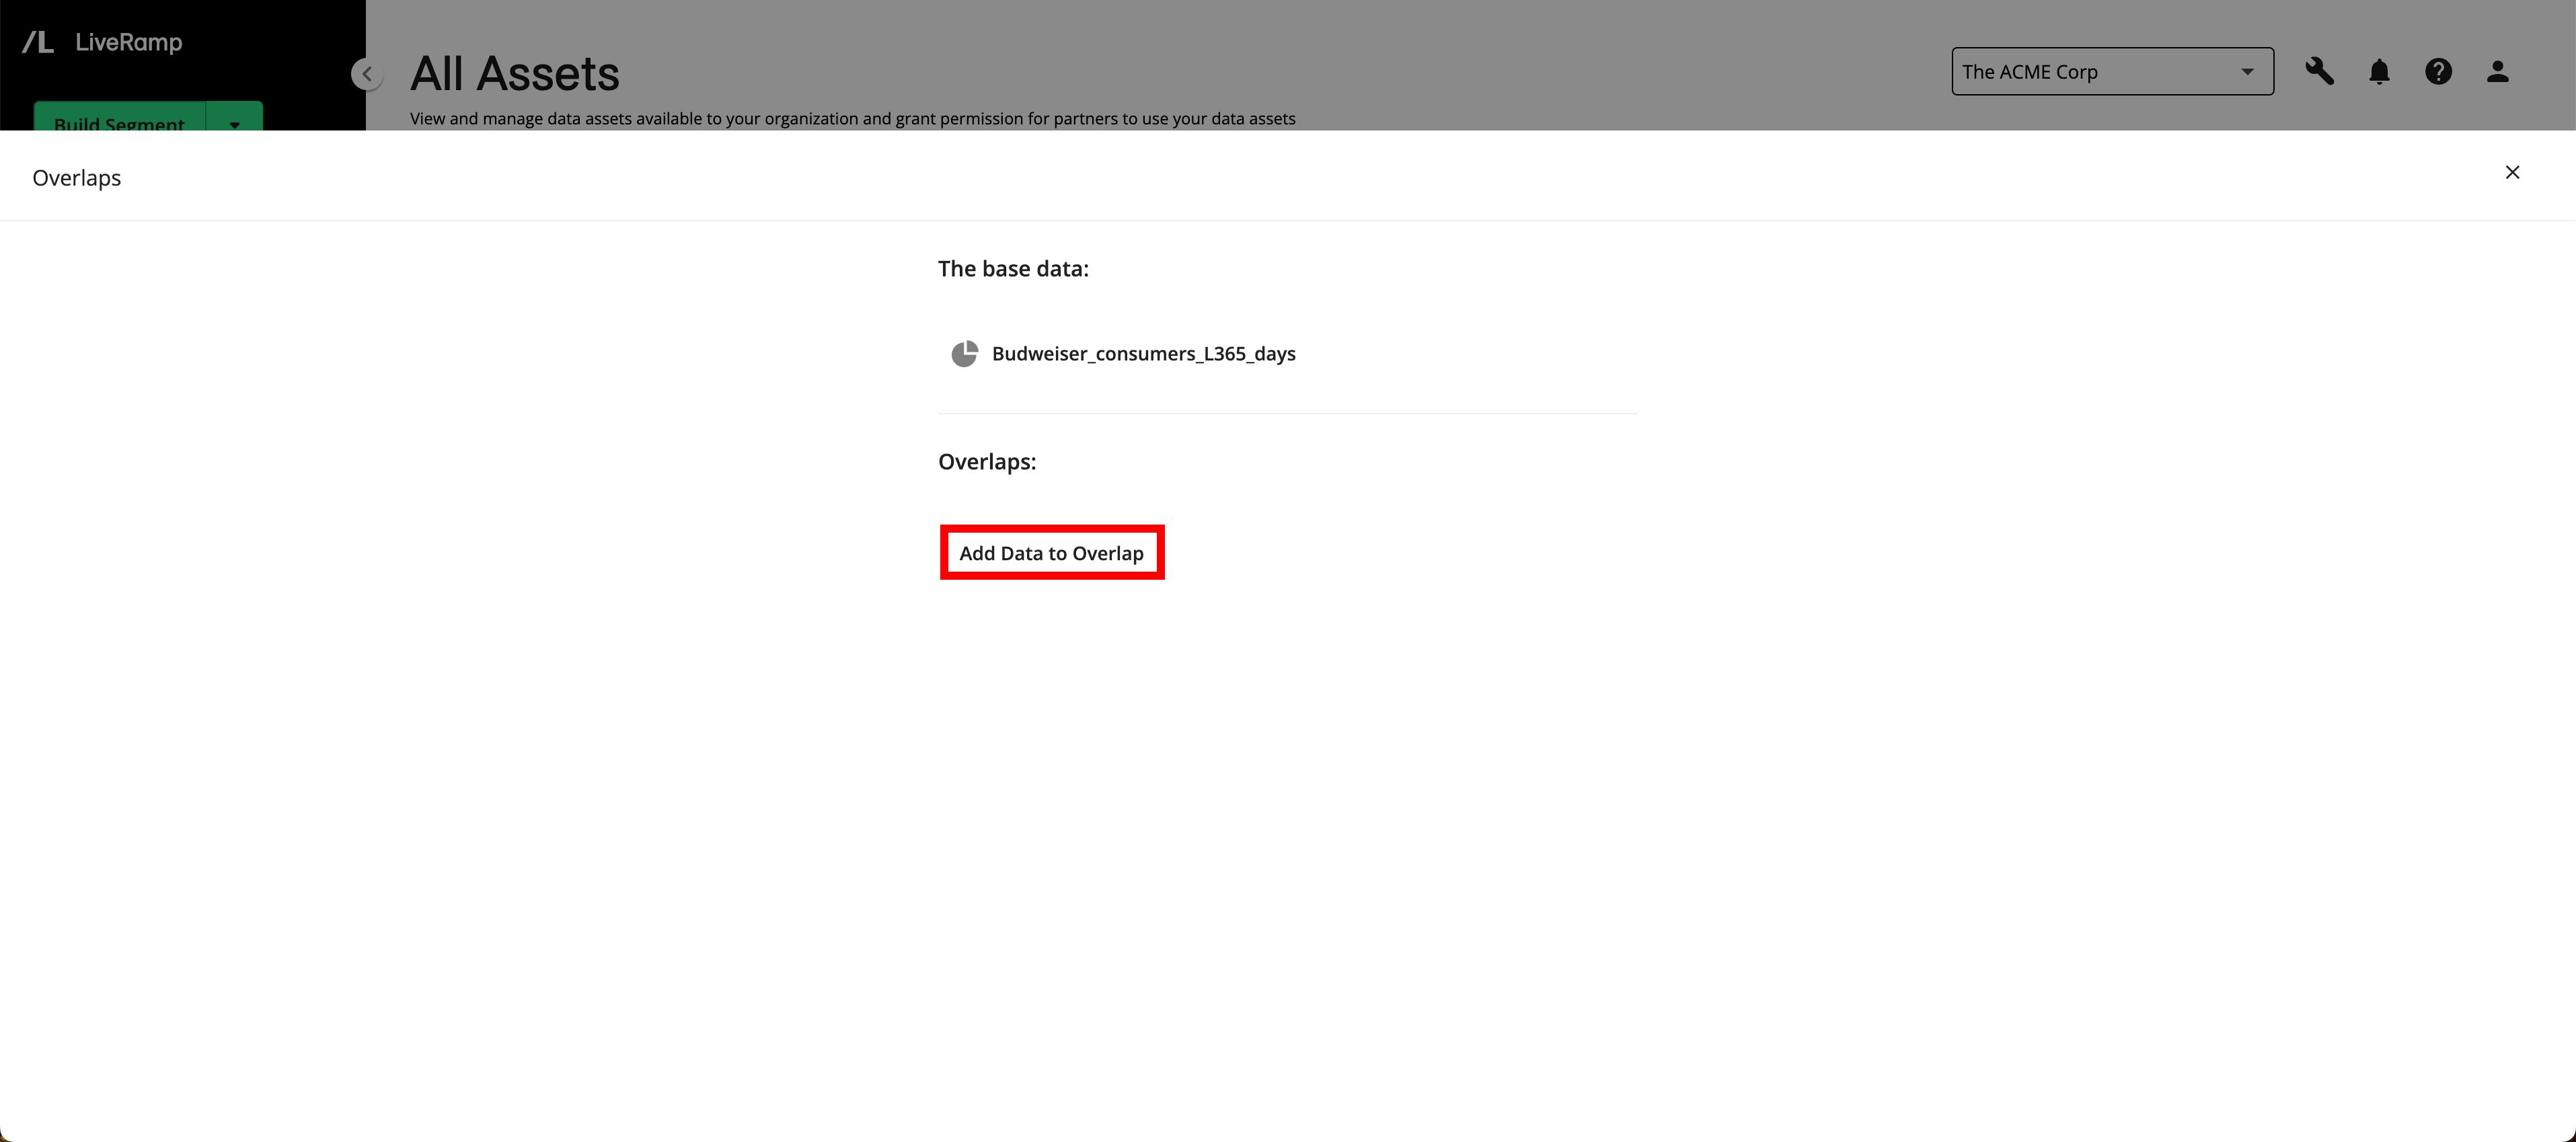
Note
If you've previously performed an overlap, your last selections will be displayed.
If you select a table attribute, complete the filter rule by entering or selecting the value(s) to filter on.
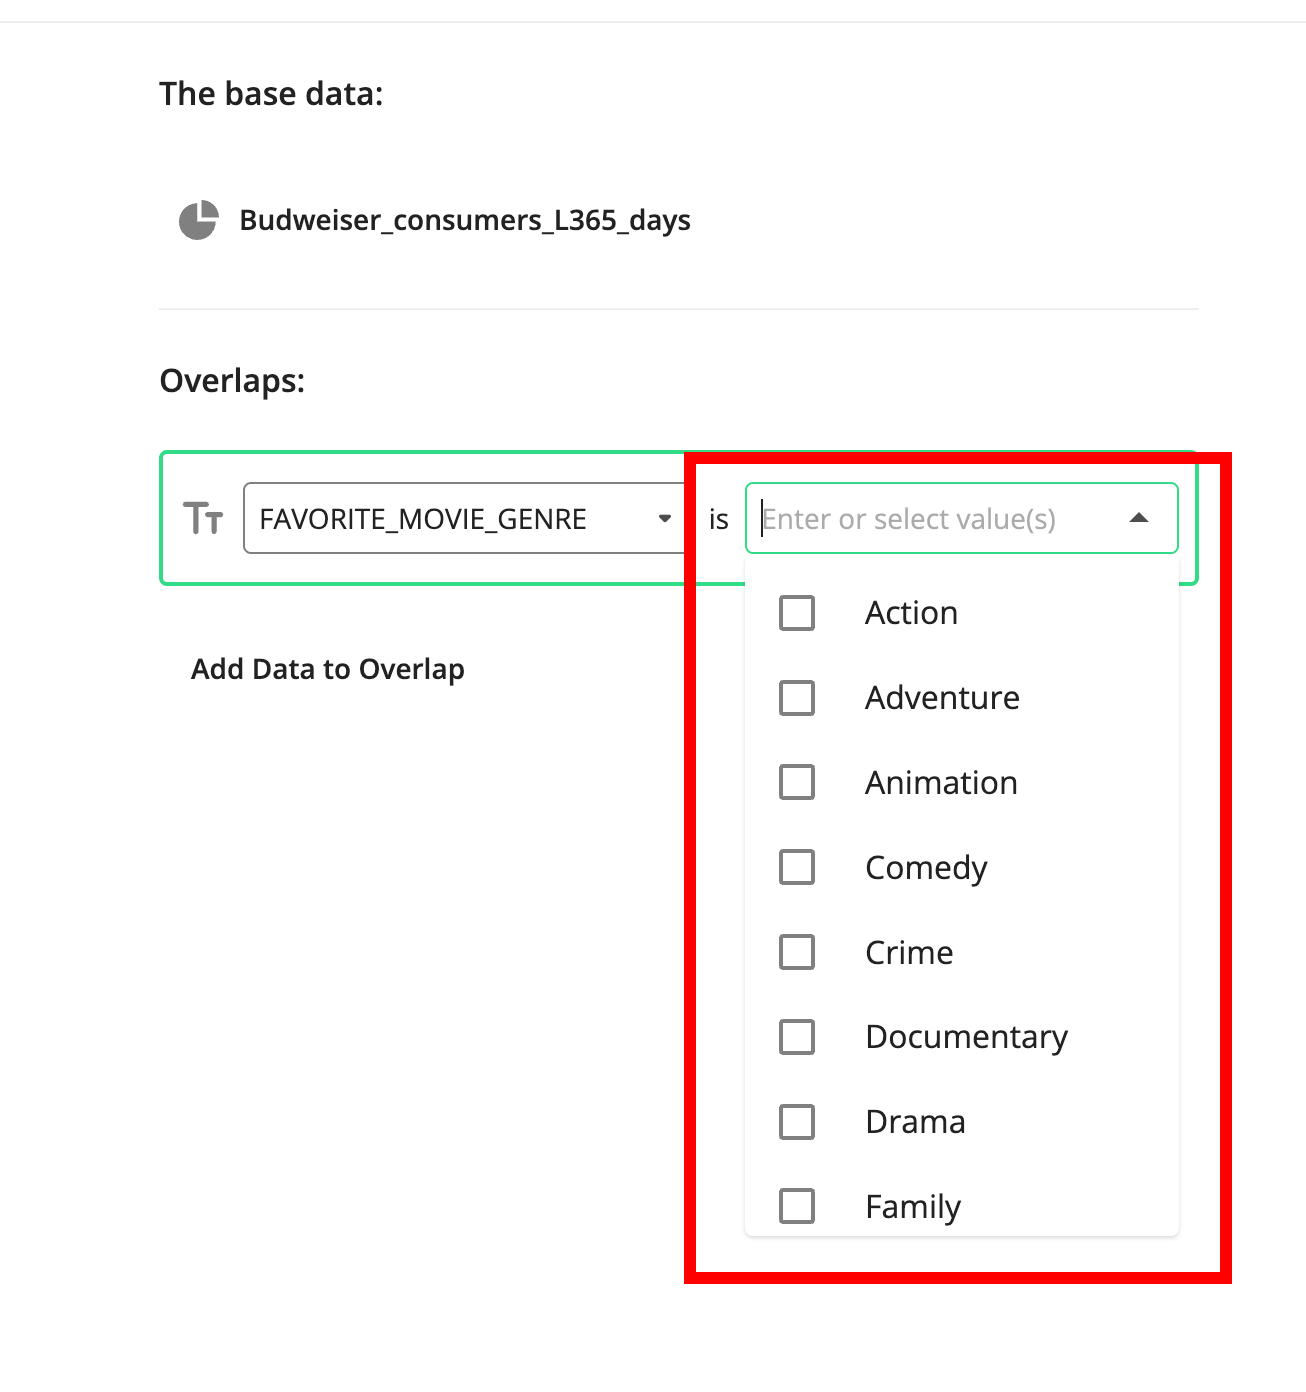
Note
If you selected a segment or all members of a table, skip this step.
Repeat the previous two steps for any additional assets you want to add to the overlap.
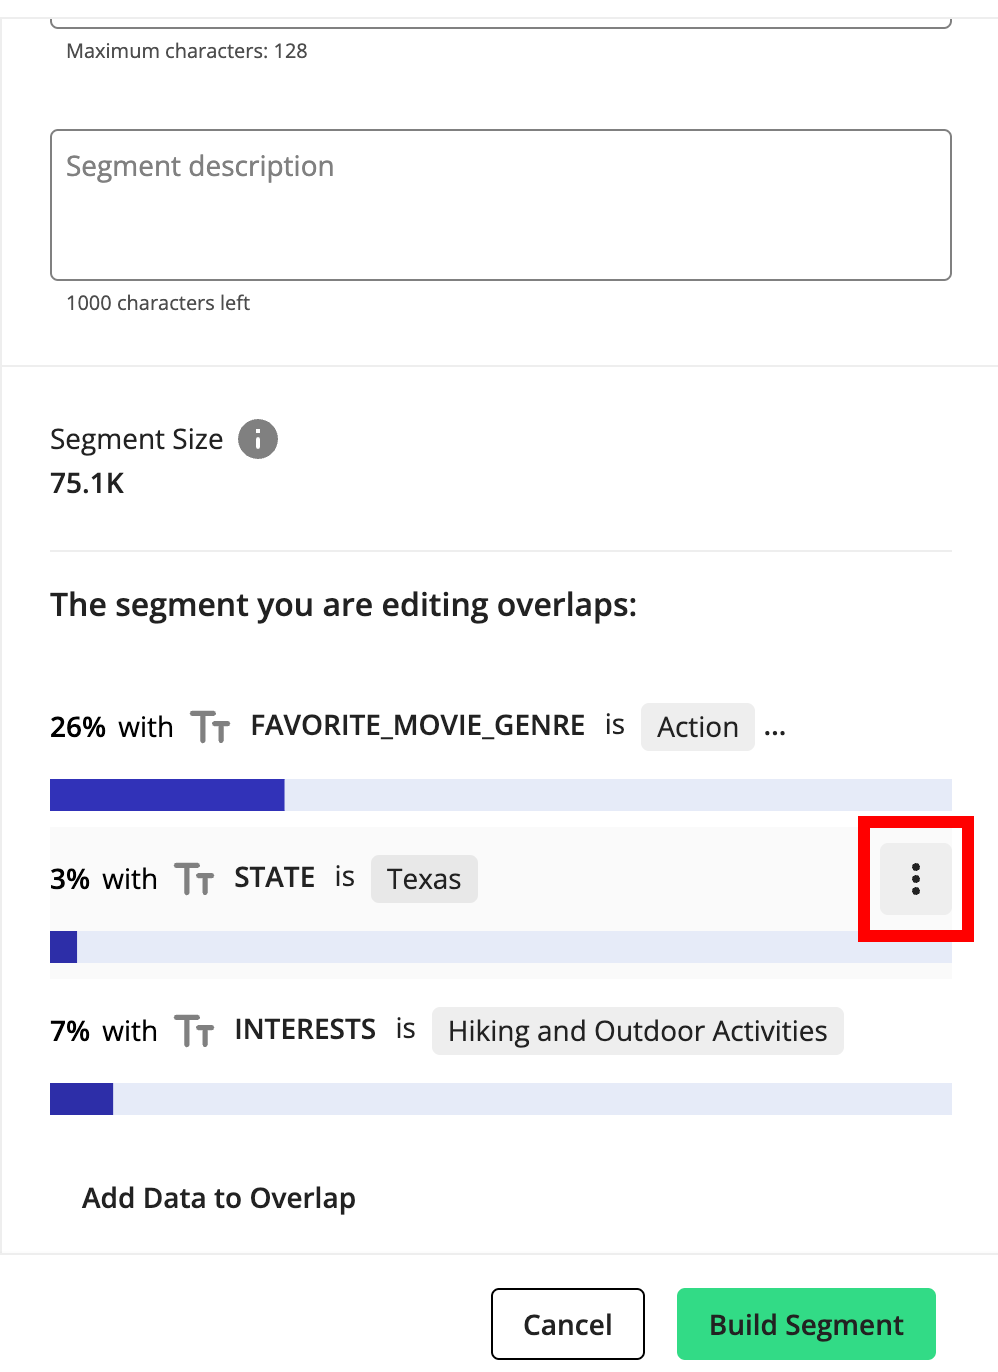
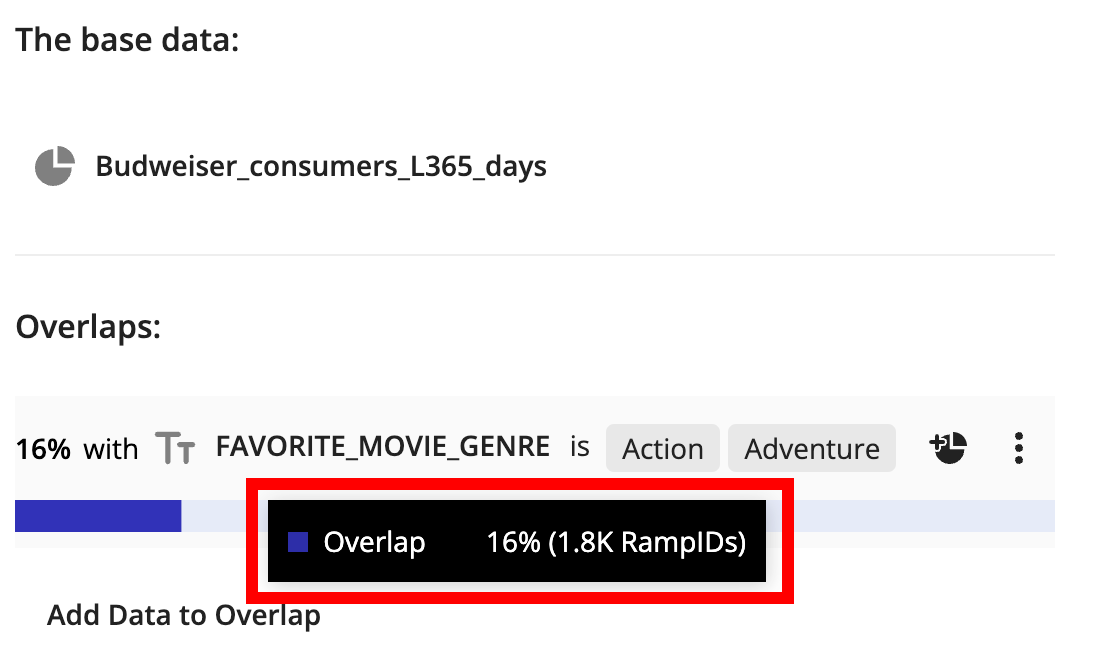
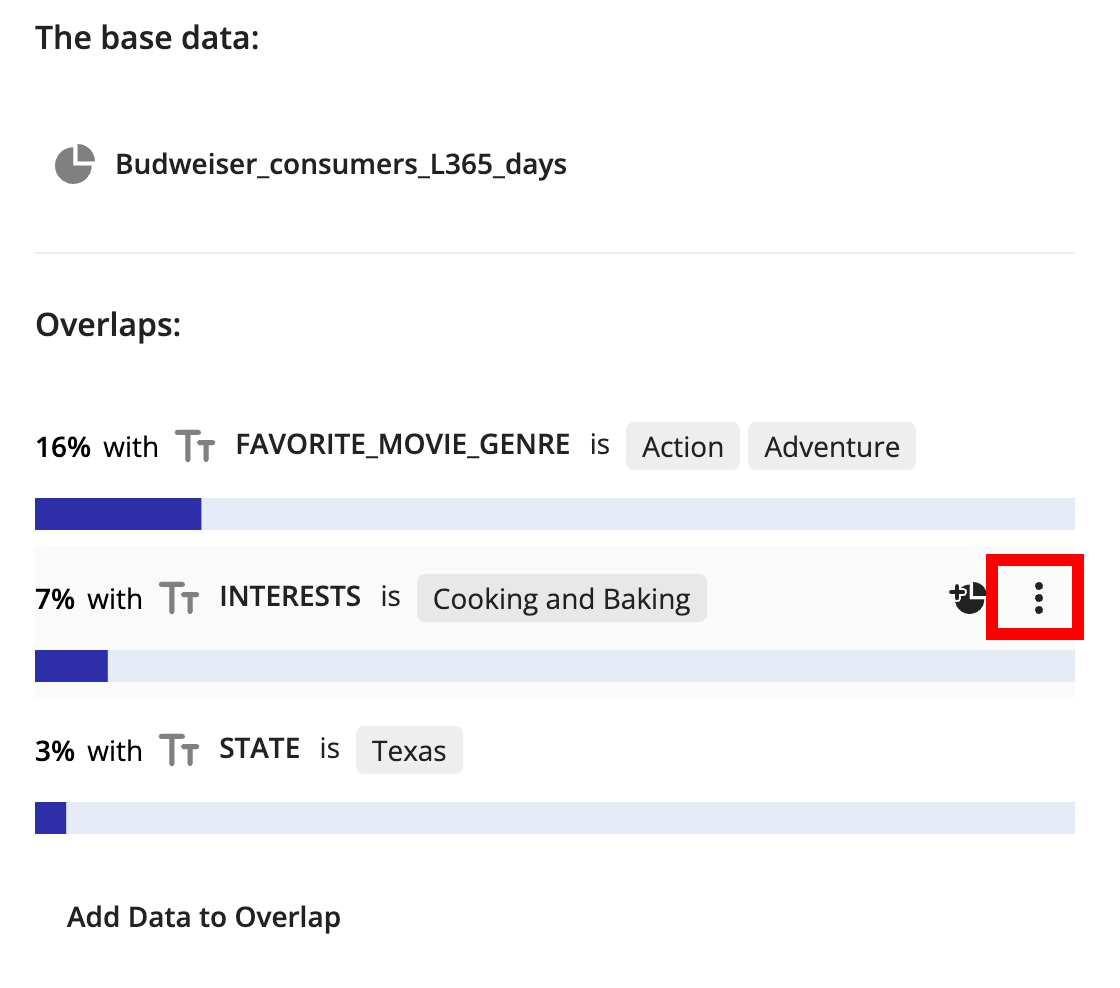
To see a breakdown of the number of RampIDs in the overlap (in addition to the overlap percentage displayed with the bar chart), hover anywhere over the bar chart.
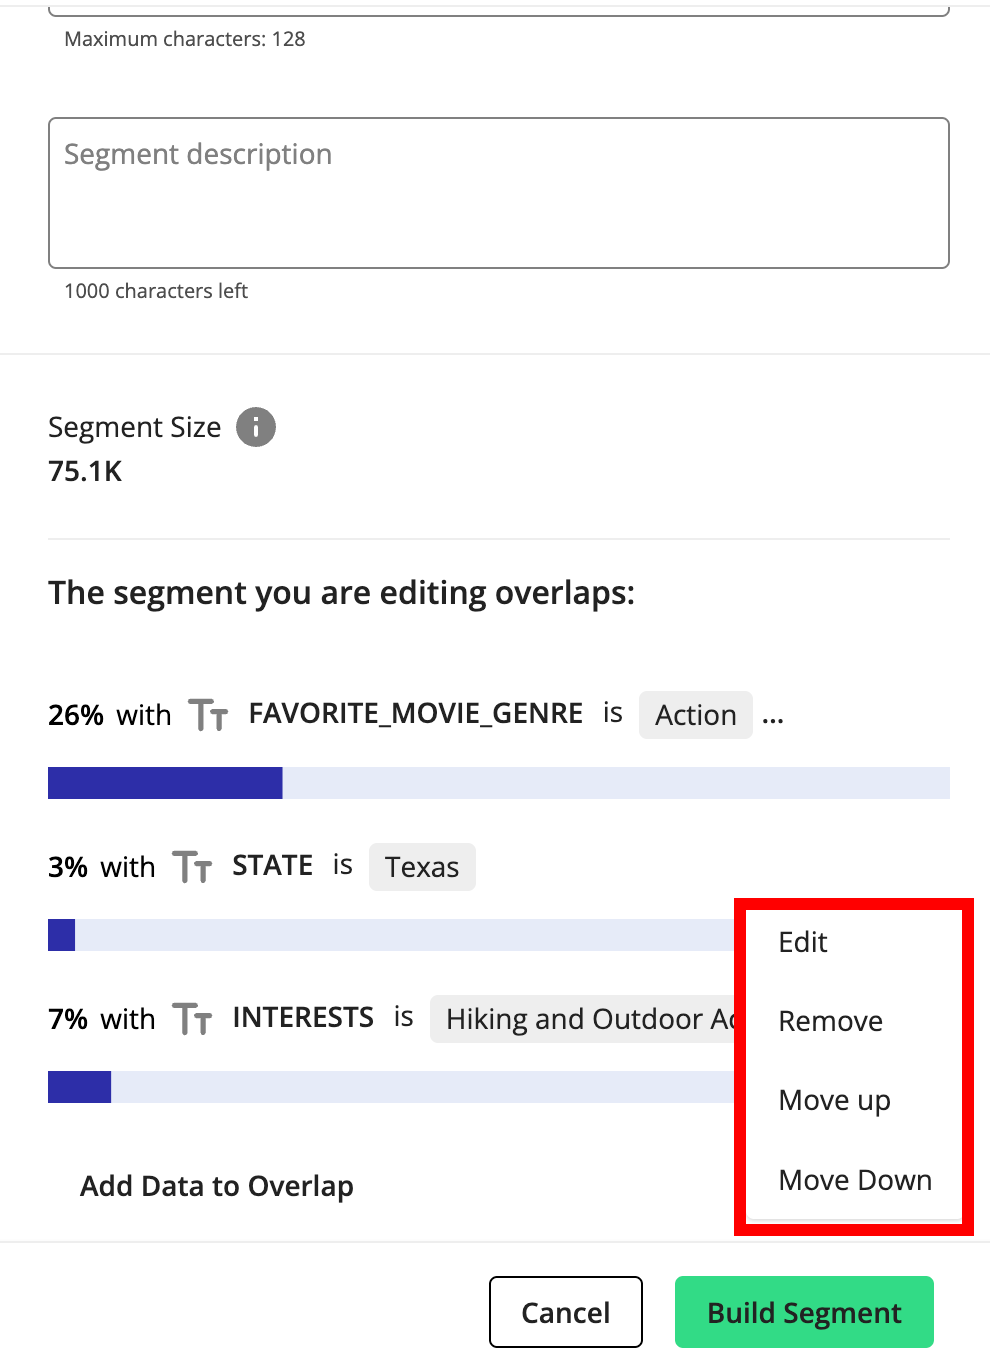
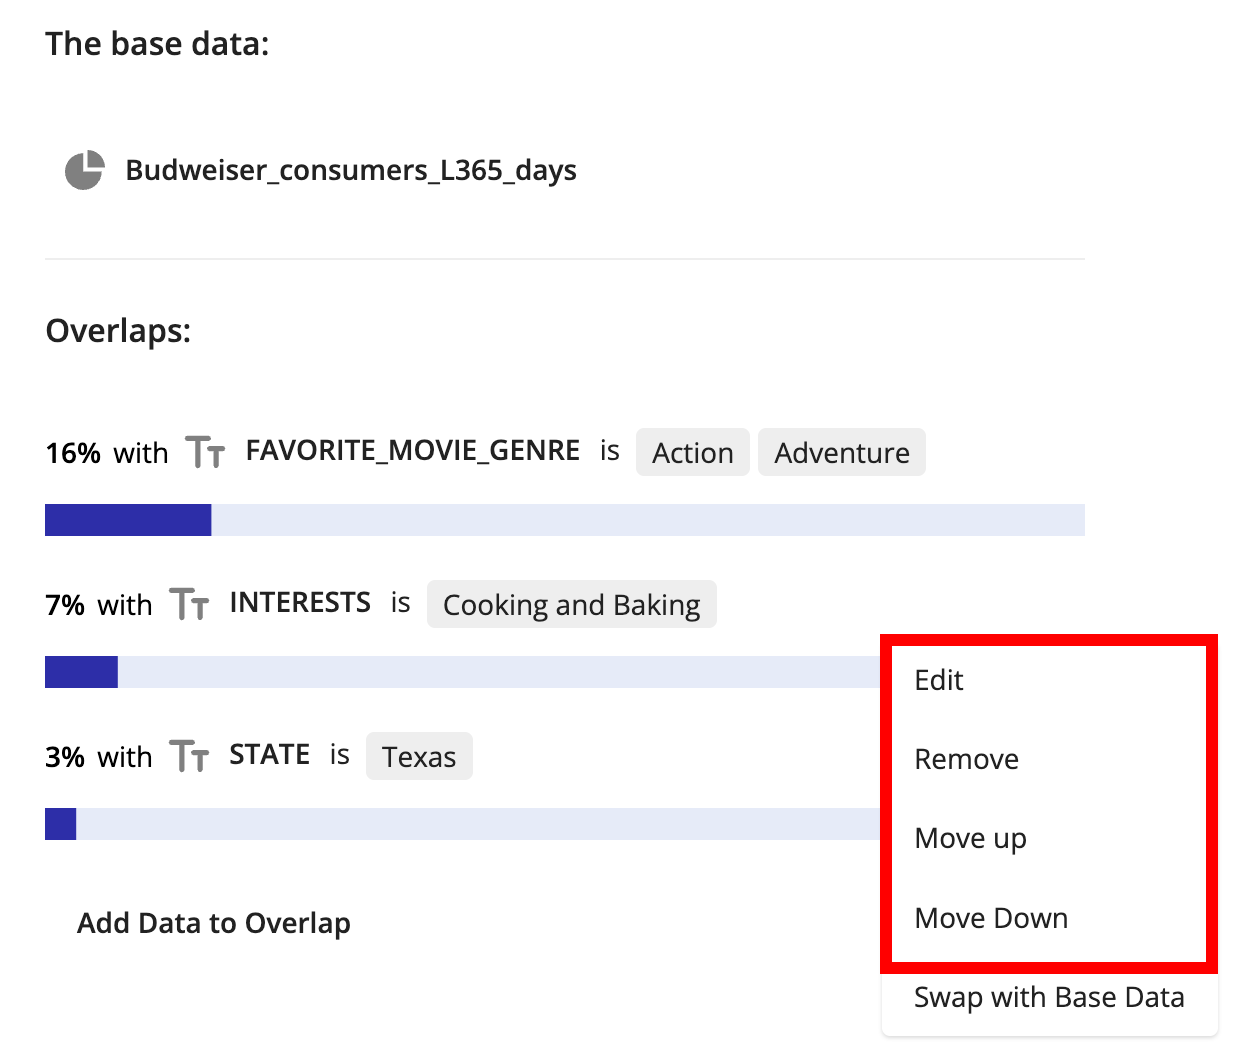
Once you've added the data assets to overlap with, you can reposition, edit, or remove each asset. Click the More Options menu (three dots) that appears when you hover over an asset and then select the desired option.
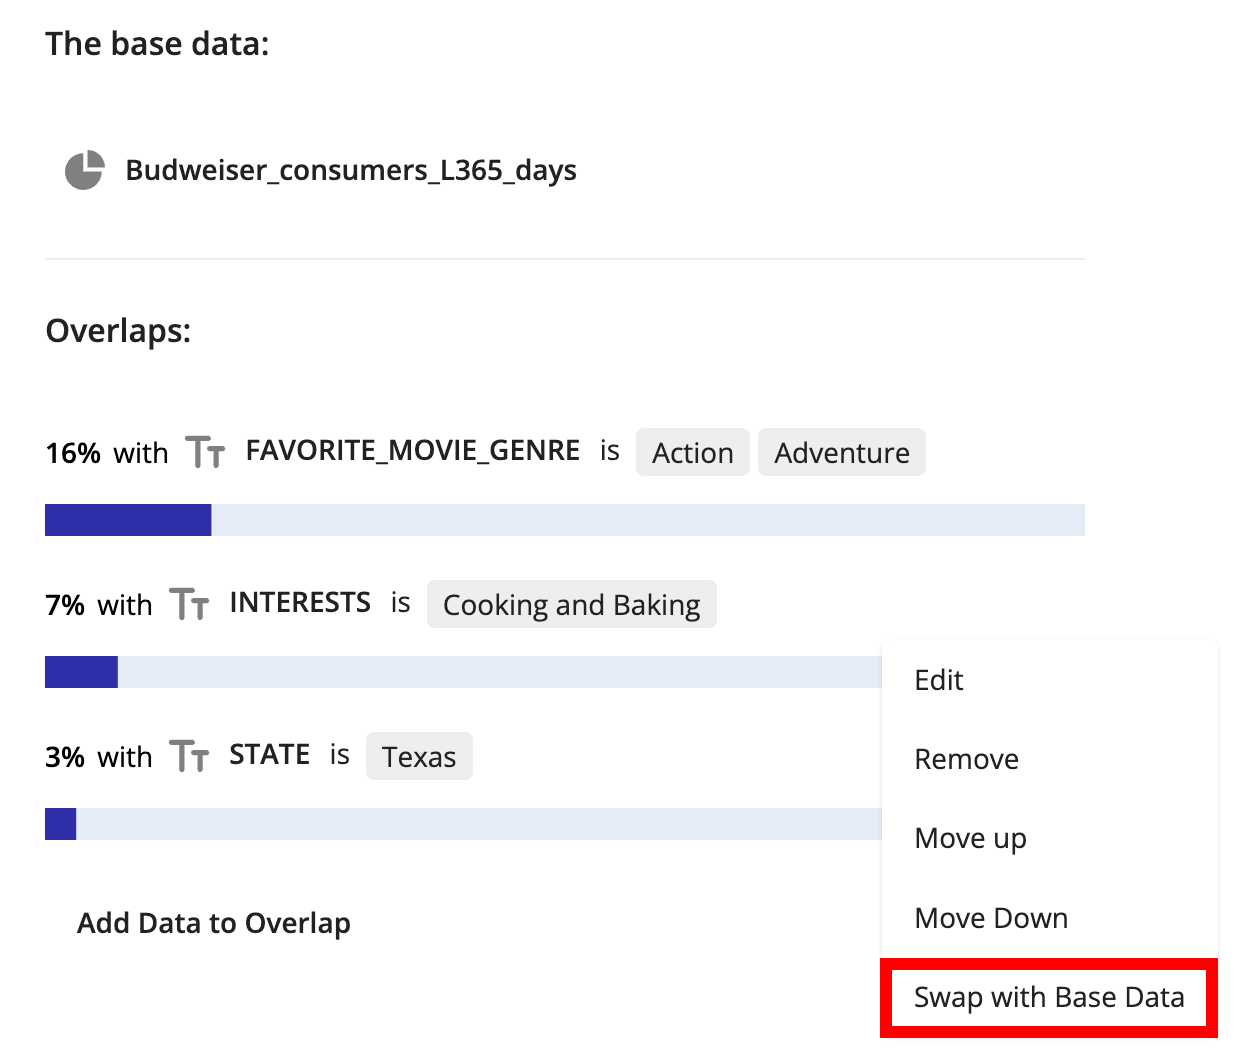
To swap one of the overlap assets with the base data, click the More Options menu (three dots) that appears when you hover over an asset and then select "Swap with Base Data".
To build a segment from the base data and one of the overlap assets, click the Build Segment button that appears when you over over the asset.
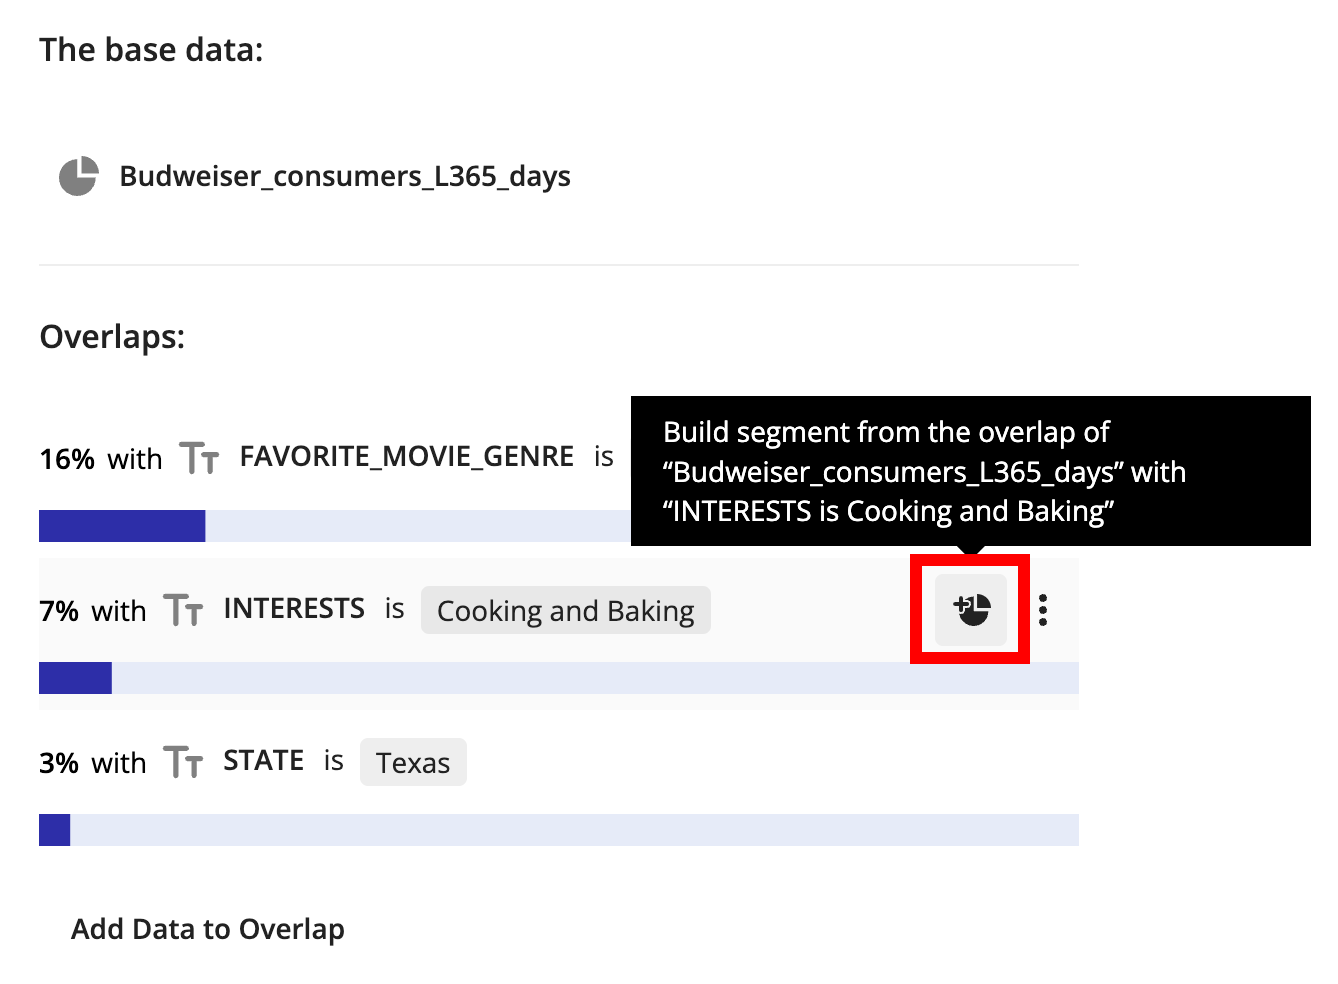
The Segment Builder opens with the two assets joined with an "AND" conjunction.
Overlap Data with the Segment Builder
If you have a more complex overlap use case, use the Segment Builder, as you can create a compound segment to use as the base data. For example, you want to overlap (people who are baseball fans AND like a certain beer) with regions.
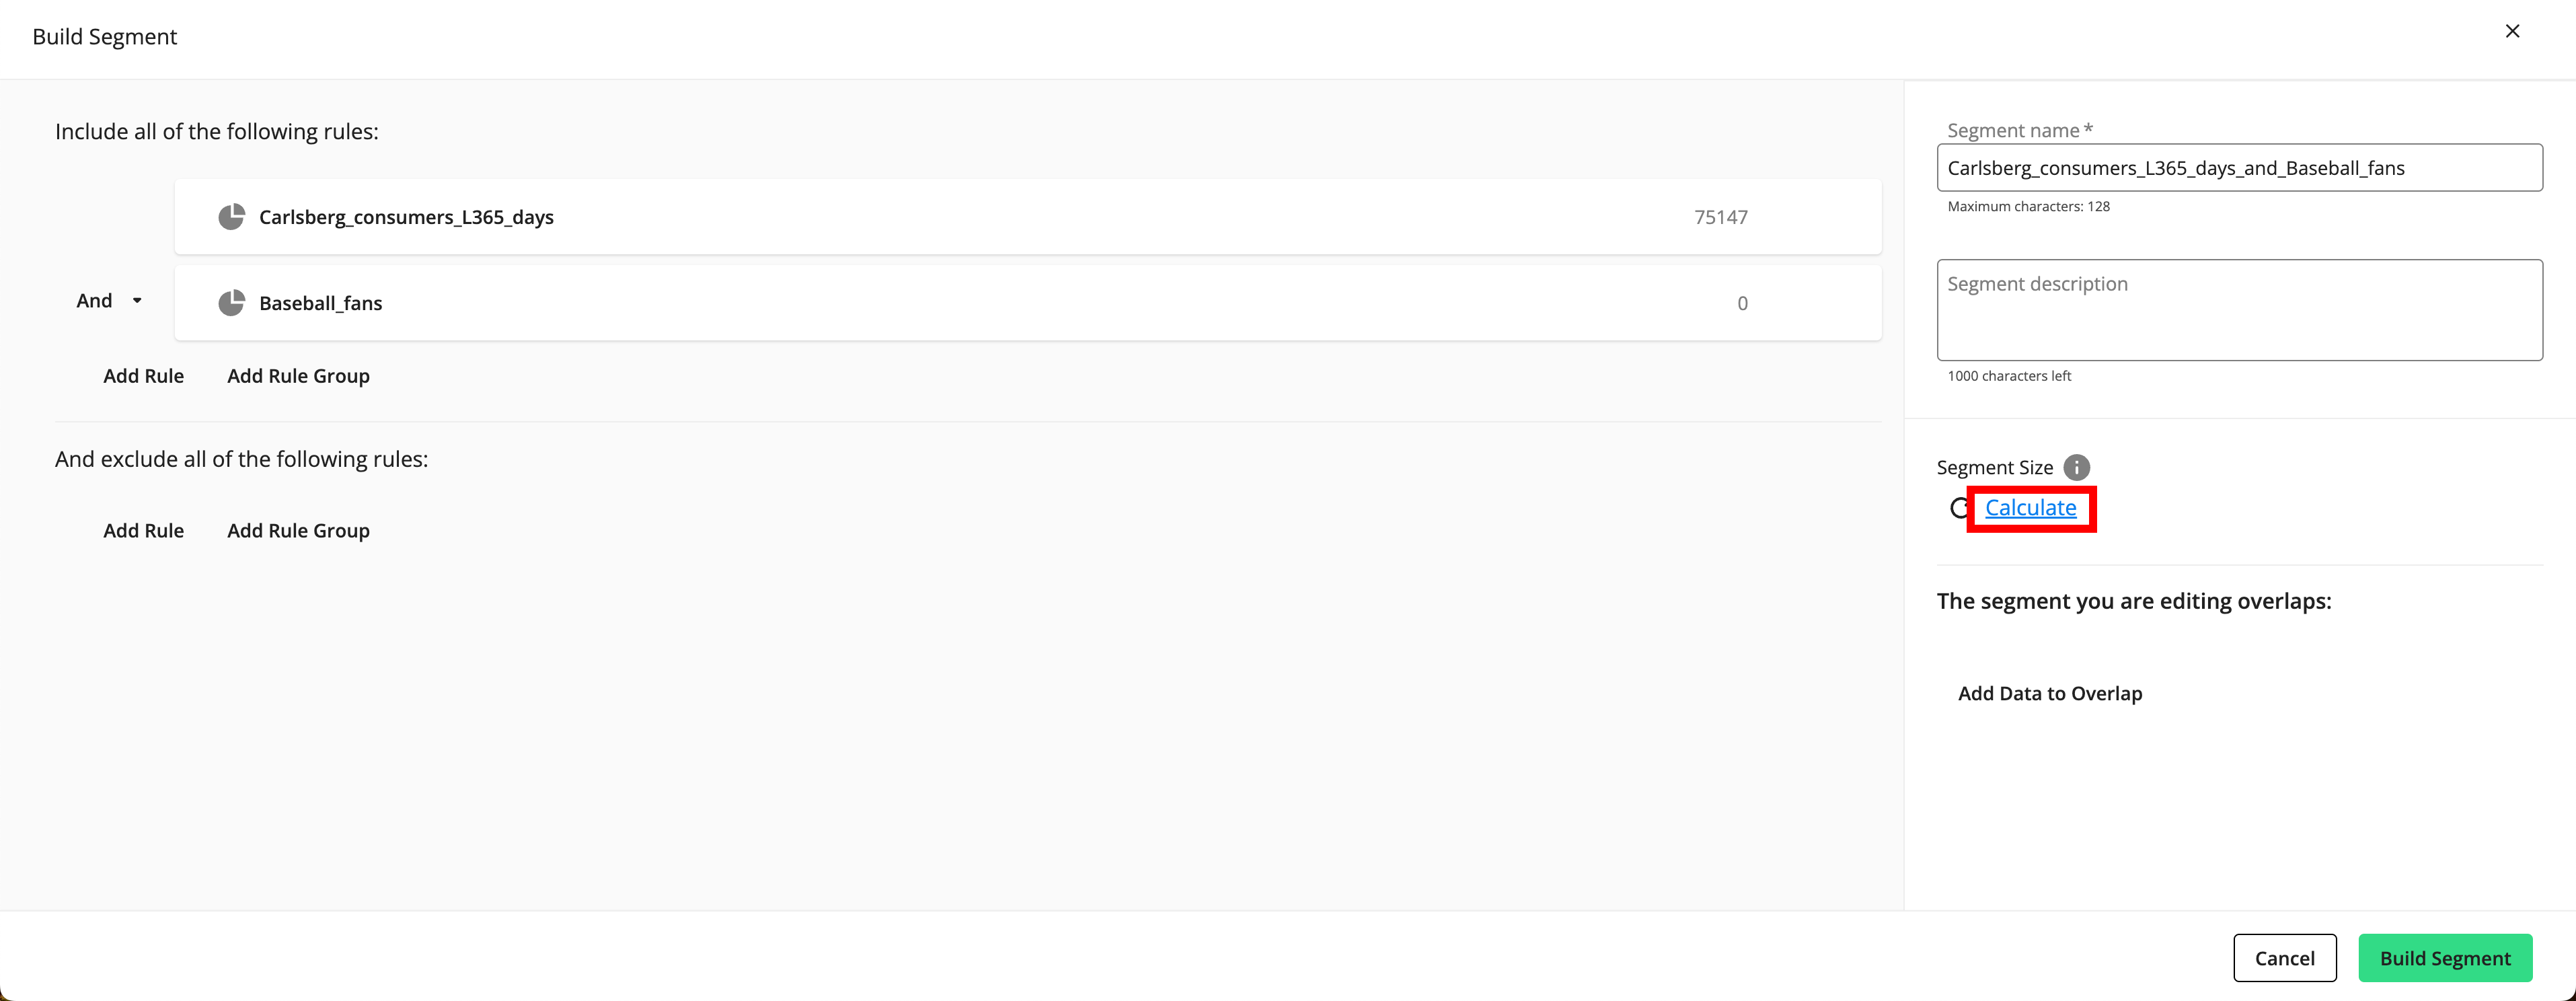
During segment building, you can overlap the segment you're building with other data assets to see how they compare:
Once you have your segment constructed in the Segment Builder, click to see the segment size.
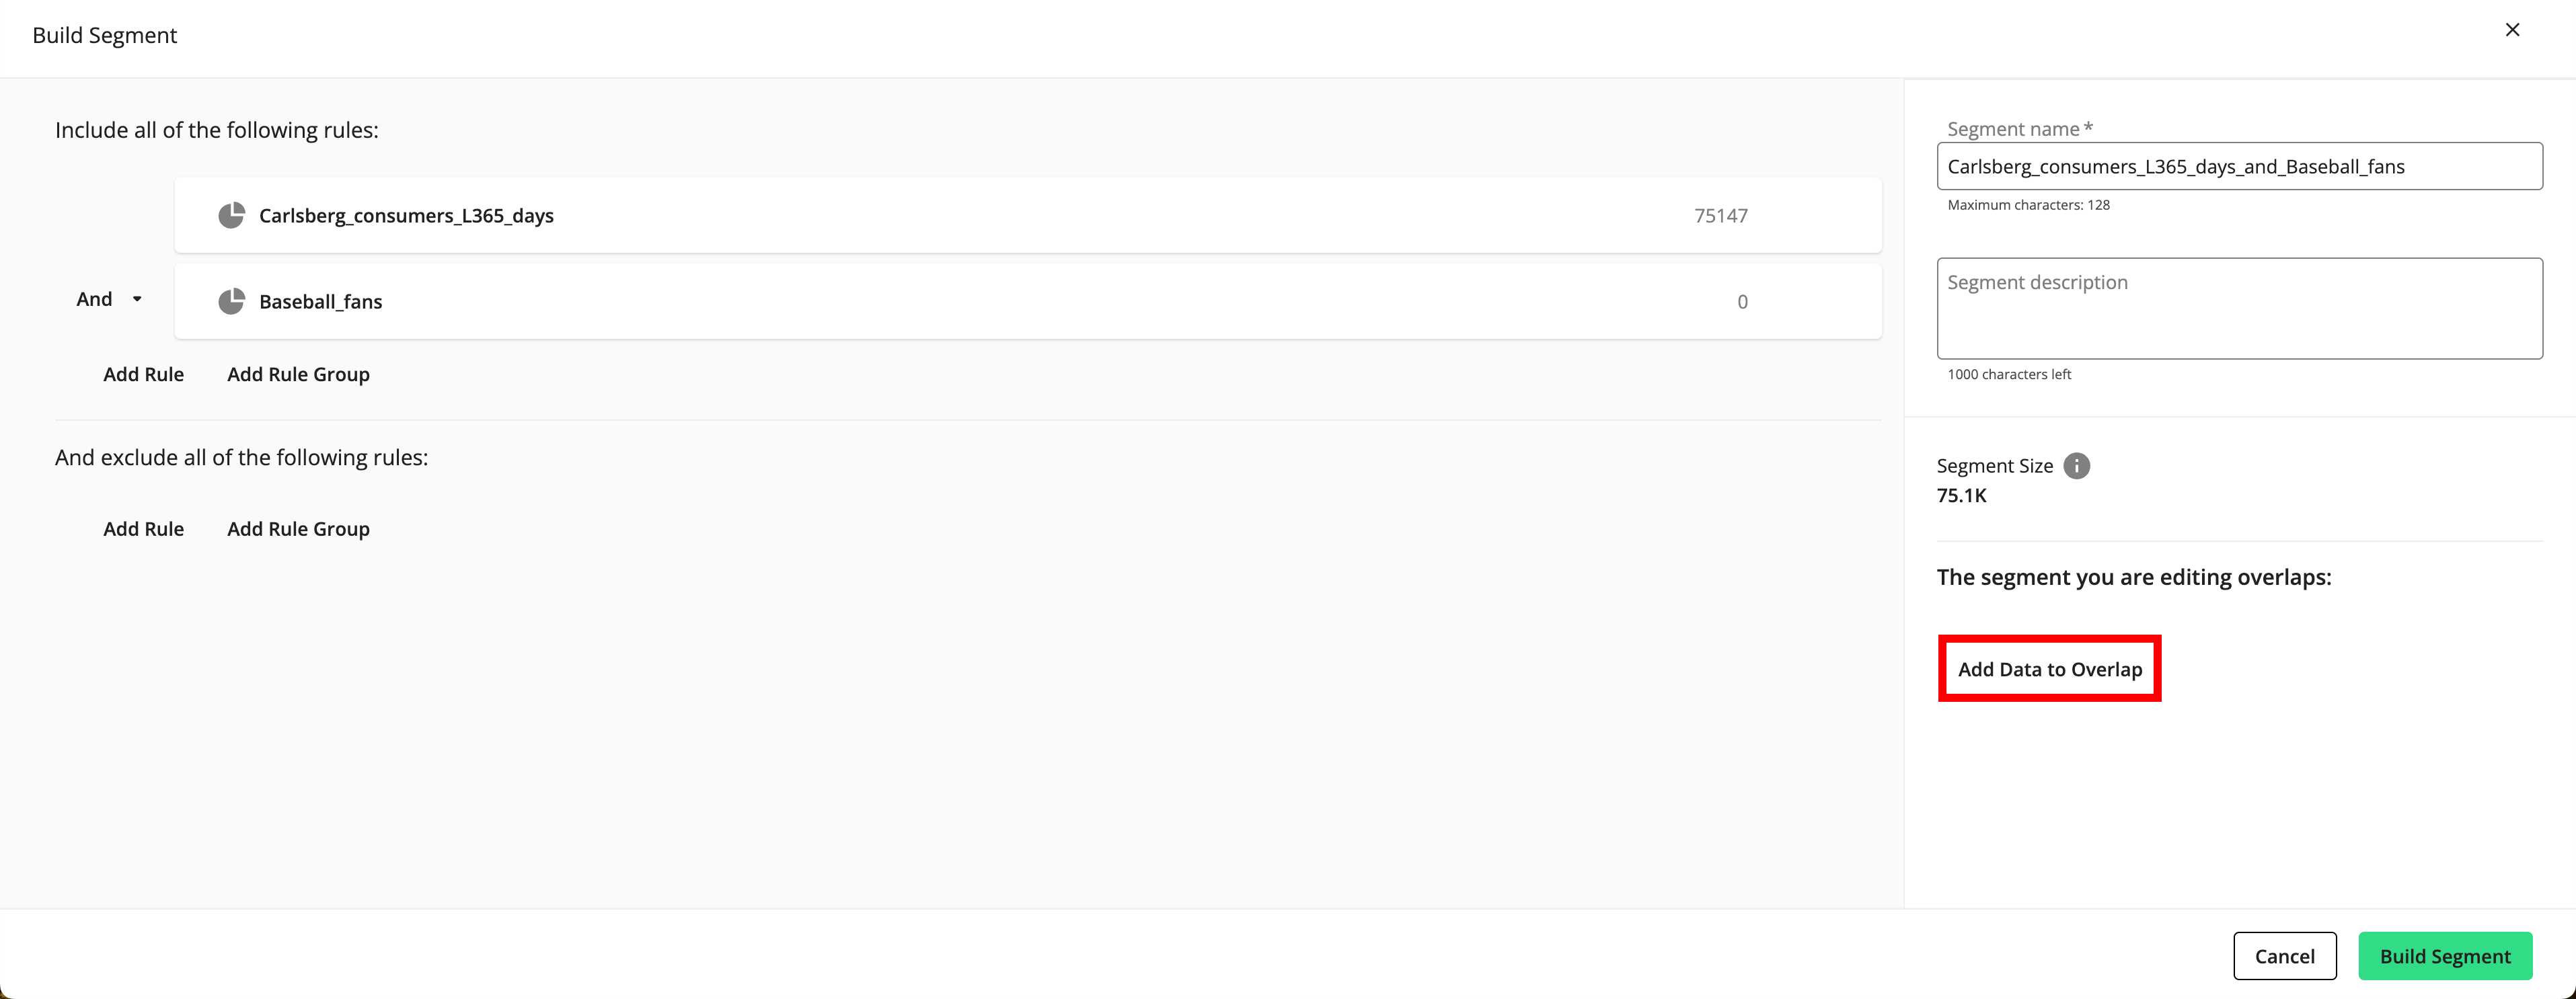
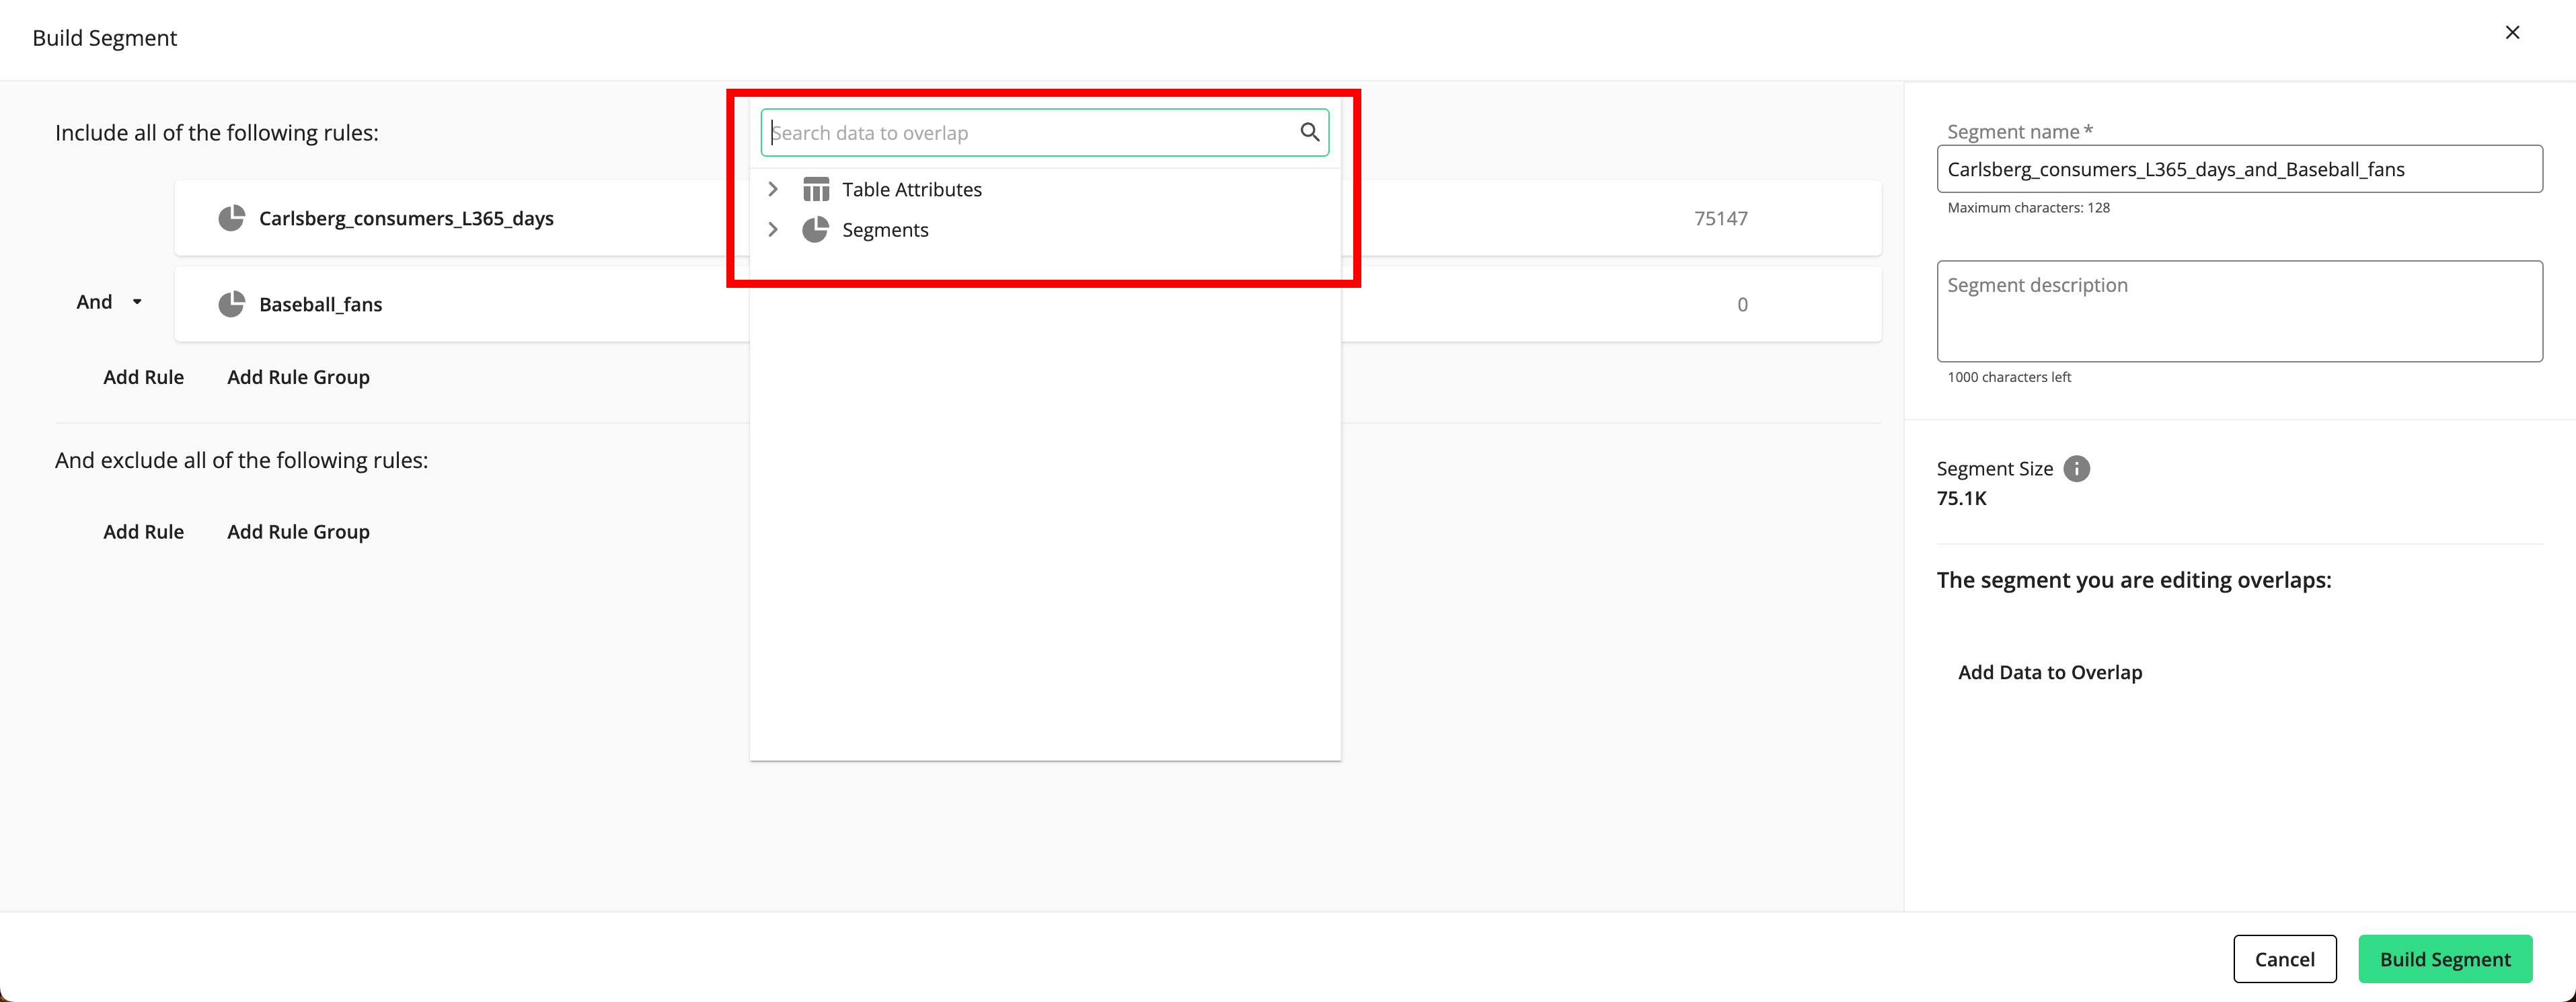
Click and then select the desired data asset.
Note
If you've previously performed an overlap, your last selections will be displayed.
You can only select your first-party segments and tables that are not in an error or pending status. You cannot select a user-defined function or a segment or table that is an error or pending status to perform an overlap.
If you select a table attribute, complete the filter rule by entering or selecting the value(s) to filter on.
Note
If you selected a segment or all members of a table, skip this step.
Repeat the previous two steps for any additional assets you want to add to the overlap.
Note
You cannot select more than 11 total assets.
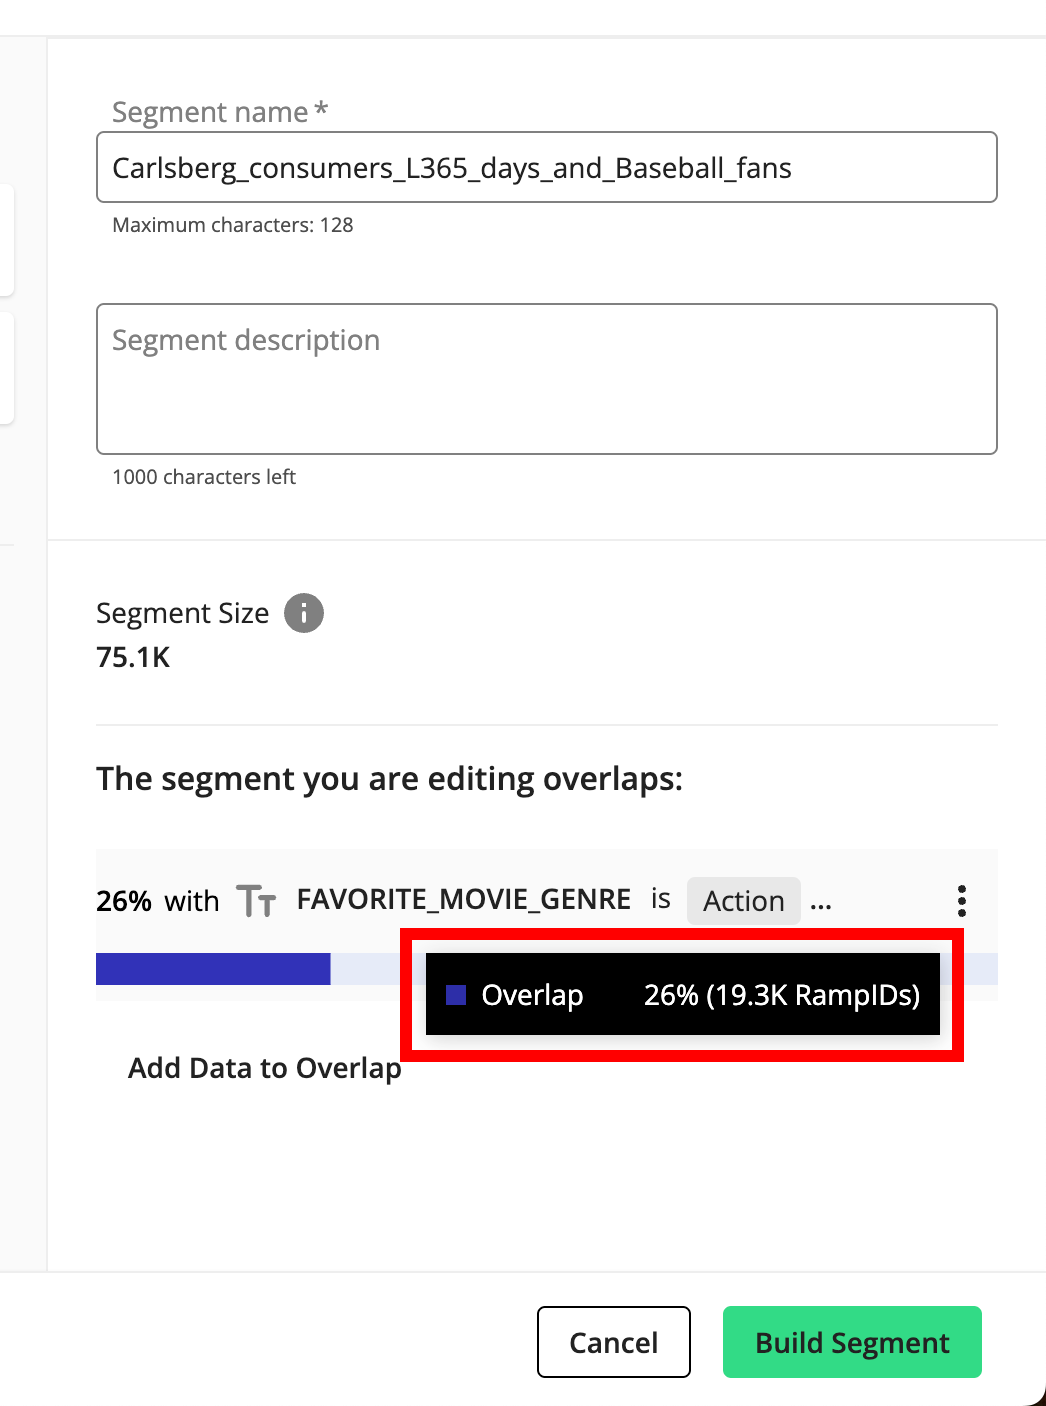
To see a breakdown of the number of RampIDs in the overlap (in addition to the overlap percentage displayed with the bar chart), hover anywhere over the bar chart.
Once you've added the data assets to overlap with, you can reposition, edit, or remove each asset. Click the More Options menu (three dots) that appears when you hover over an asset and then select the desired option.