Analytics Library
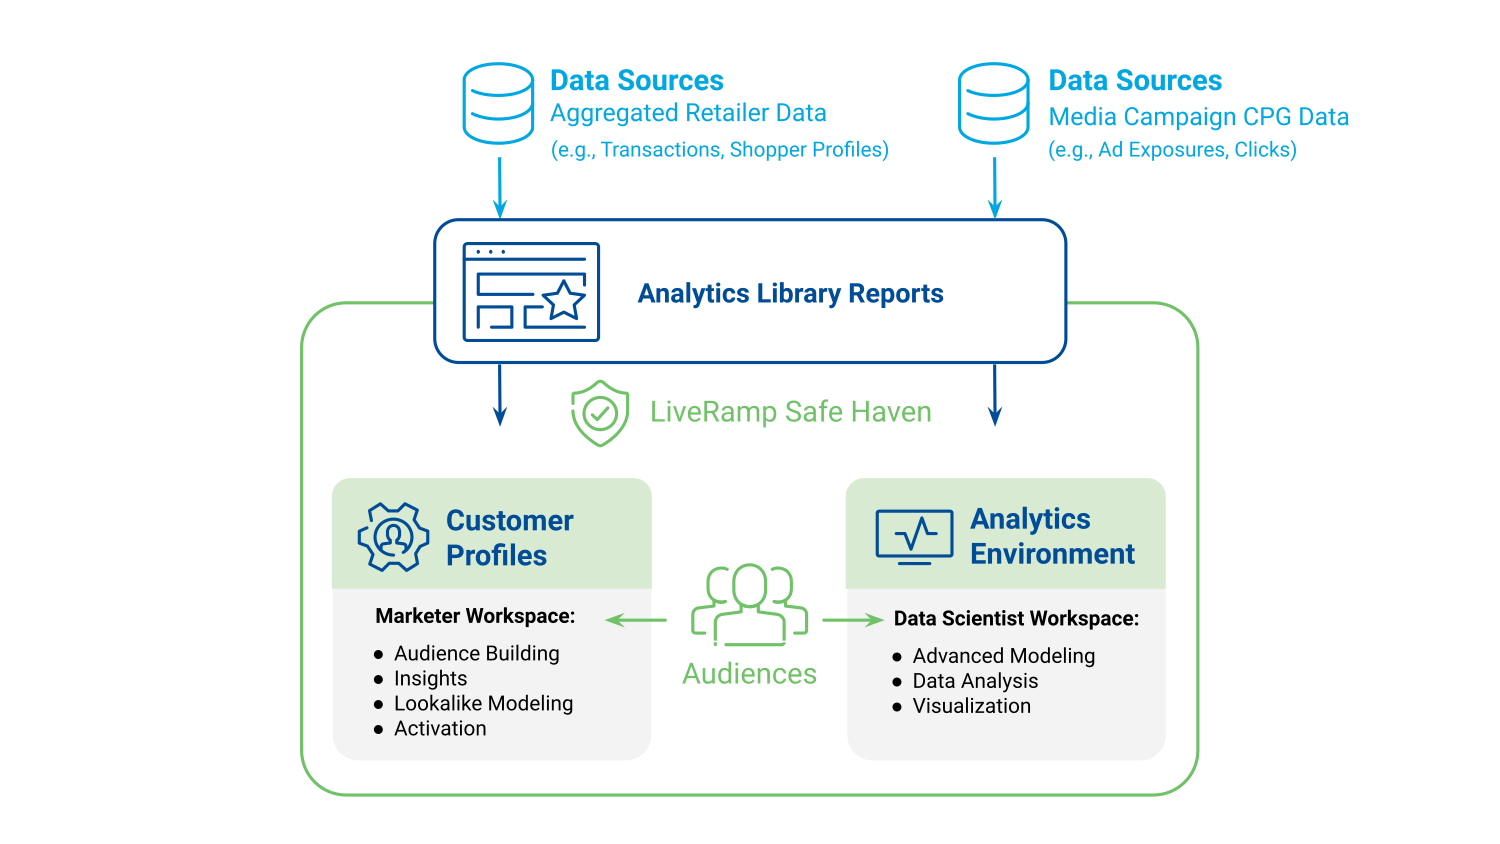
The Safe Haven Analytics Library is a collection of analytical dashboards to help understand the business performance and shopping behaviors of your business and your brand buyers. The Analytics Library provides detailed insights on what's happening in your market (categories, brands, and products) to help you make better decisions, target the right shoppers, and measure the impact of your investments.
Your access to Analytics Library reports depends on:
Your company's Safe Haven implementation
The country from which you connect to your Safe Haven tenant
Tasks You Can Perform
You can use the Analytics Library to securely do the following:
Interact with insightful reports gathered in themes and sub-themes, such as the Shopper Insights theme and its Loyalty sub-theme.
Send segments of shoppers to Customer Profiles or the Analytics Environment by clicking on reports.
Save the audience directly in the dashboards depending on your needs.
Navigating the Analytics Library
In Safe Haven, go to → . There are two ways you can access the dashboards: Guided Analytics or Non-Guided Analytics.
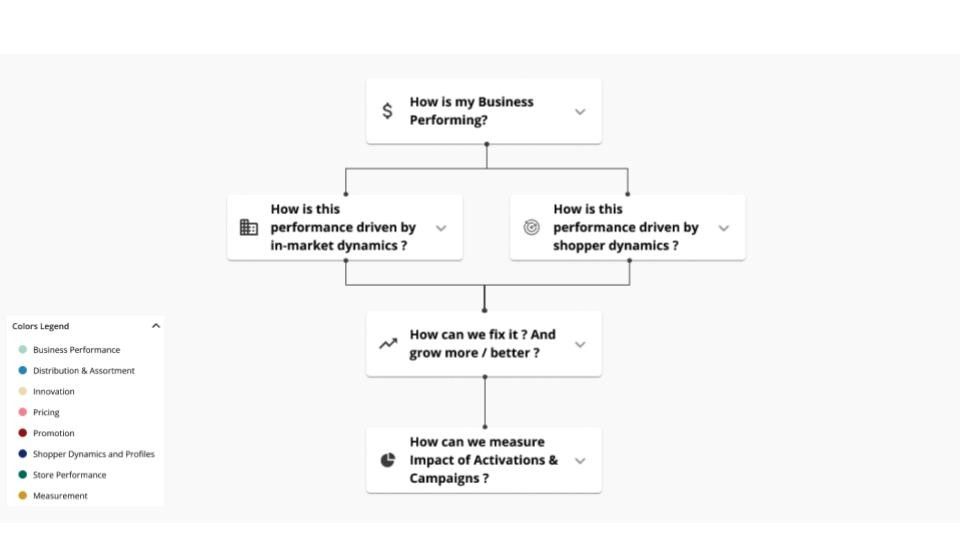
Guided Analytics
The guided analytics groups the dashboards into simple business questions. You can click on each question to see the breakdown of all related dashboards. These questions can help guide you to find which dashboards might be useful based on the business questions you want to answer.
Click on the bottom of the page to learn which topic the color of each tab represents.
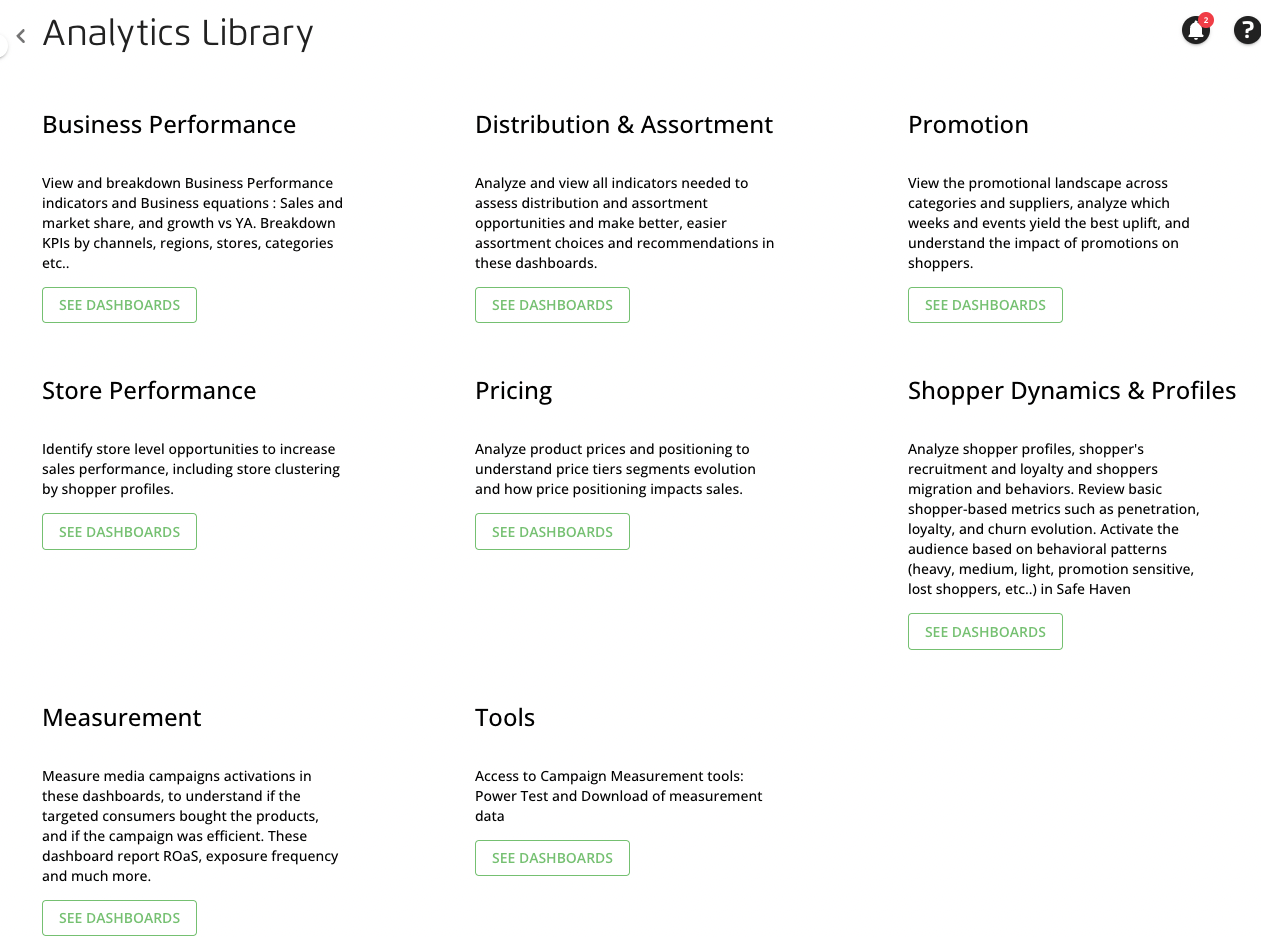
Non-Guided Analytics
Non-guided analytics separate the dashboards based on the area of work. This might be useful if you want to quickly access dashboards that are only relevant to your area of work. Click See Dashboards on a preferred area of work to go deeper into the topic and see related dashboards.
Dashboard Features
Each dashboard contains multiple features to help you gain more insights into the data. For example, you can hover over a bar or click on one to drill down into each data. Below are some of the dashboard features to help you work effectively with the Analytics Library:
Chart Icons
Learn what each icon within the dashboard does below:
 : Move around the chart where applicable
 : Zooms in on the whole chart
 : Selects multiple objects in the chart
 : Zooms in on specific areas
 : Activates or deactivates chart selections
 : Resets charts to default or previous upper level
 : Saves the chart to your PC
 : Activates or deactivates the hover-over tooltips
Filters
On the right-hand side of the dashboard screen, you can filter the data based on the following fields:
Taxonomy (Global or Local)
Currency (EUR or Local Currency)
Time Period
Country
Supplier
Store / E-commerce
Channel
Class
Category
Sub-category
Brand
Once you've added the filters, click to display the result. You can also save the filters you’ve added by clicking to ensure the same filter will be applied the next time you open the dashboard.
Save Audience
On some dashboards, you can quickly take action by saving the audience based on the data shown. To do this, simply click on the data displayed (such as a bar representing a specific brand), and scroll up to see the button. See an example of how you can take advantage of this feature in the scenario below.
Based on the data displayed in the "Share Equation" dashboard, Brand A has lost share value due to a large loss of shoppers. According to the data displayed in the “Source of Business” dashboard, these shoppers primarily went to buy Brand B, C, and D. You can click on these brands and save the audience for media communication purposes.
Formula and KPIs
Most of the information regarding the data calculation is available on each dashboard's page. To make sure our formula stays secure, we currently are not able to display all information publicly in this documentation portal. Contact our support team if you have any questions about the Analytics Library.