Viewing Safe Haven Usage Metrics
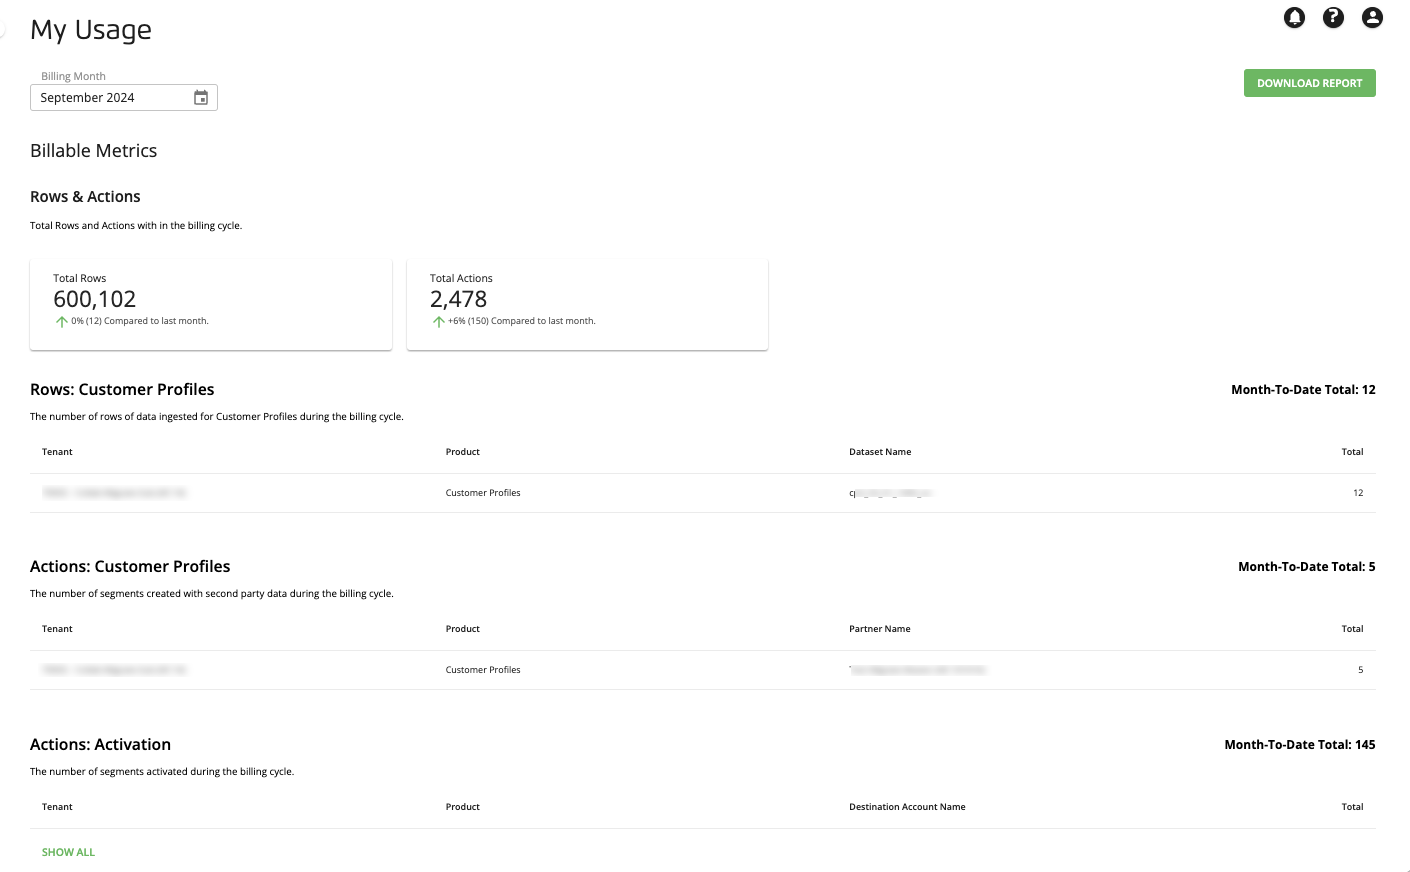
You can view Safe Haven usage metrics that affect your billing on the My Usage page.
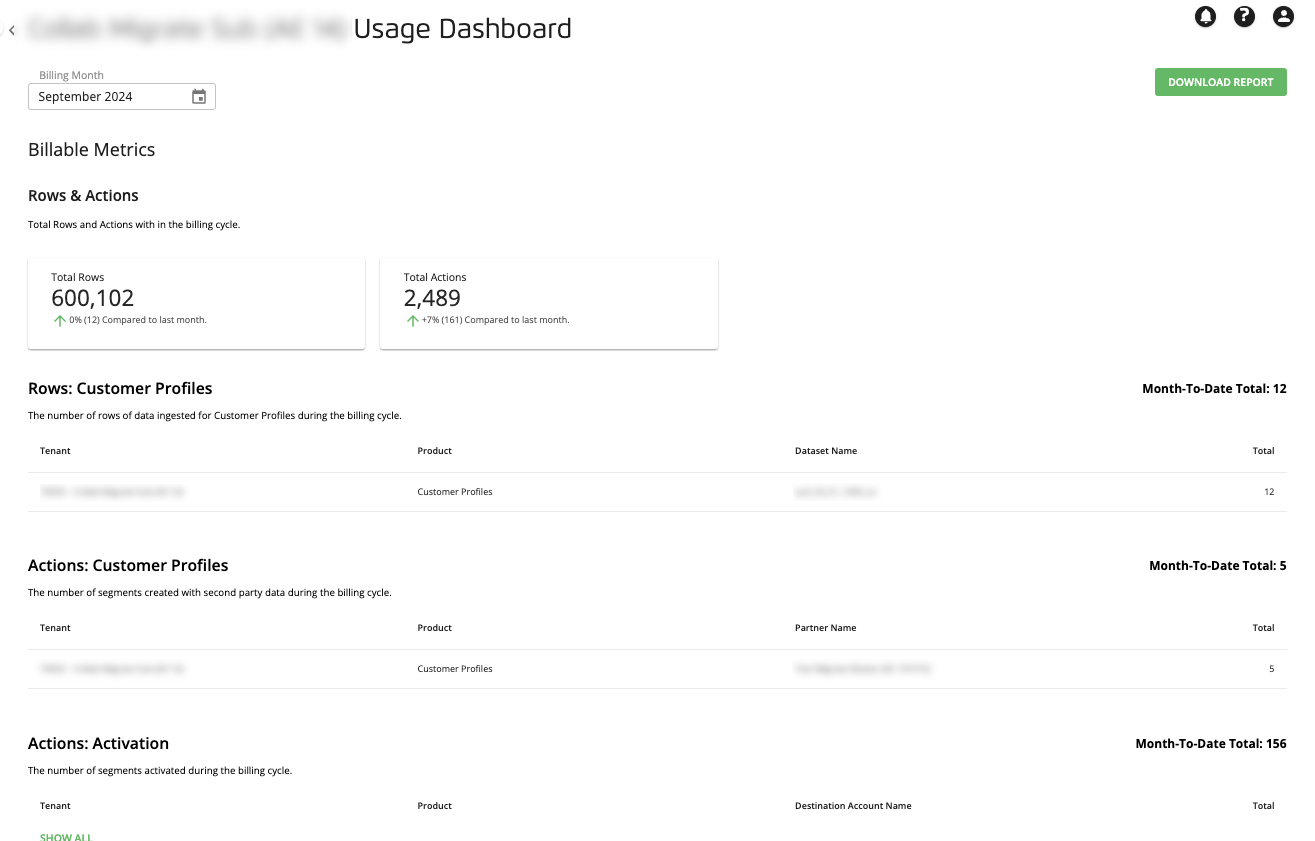
If you have partner tenants connected to your account, you can also view usage metrics for those partner tenants' accounts by navigating to the All Usage Dashboards page. For information, see "Viewing a Partner Tenant's Usage Metrics."
Note
The following usage sections display metrics based on the last time the system ran the calculations, which is usually the previous day.
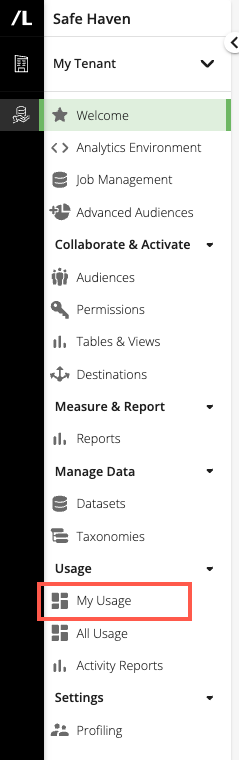
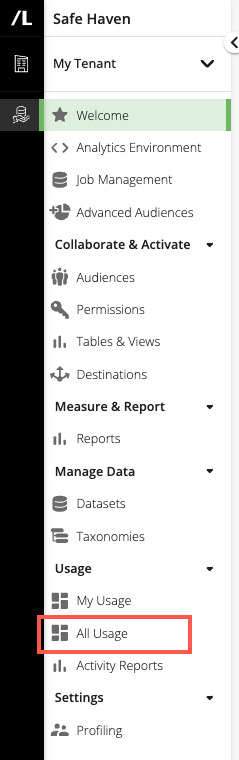
In the left navigation bar, click My Usage.
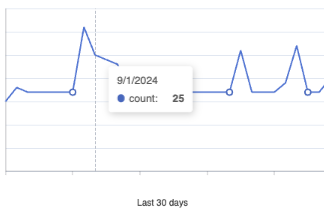
To see the precise number for a given day in the "Last 30 days" graph for a particular metric, hover over the graph line.
The Billable Metrics section contains the following metrics for rows and actions:
Total Rows: The total number of rows of data ingested during the billing cycle.
Total Actions: The total number of actions performed on customer data during the billing cycle.
Rows: Customer Profiles: The number of rows of data ingested for Customer Profiles during the billing cycle.
Actions: Customer Profiles: The number of segments created with second-party data during the billing cycle.
Actions: Activation: The number of segments activated during the billing cycle.
The Other Metrics section contains metrics for audiences, segments, data ingestion, and the Analytics Environment.
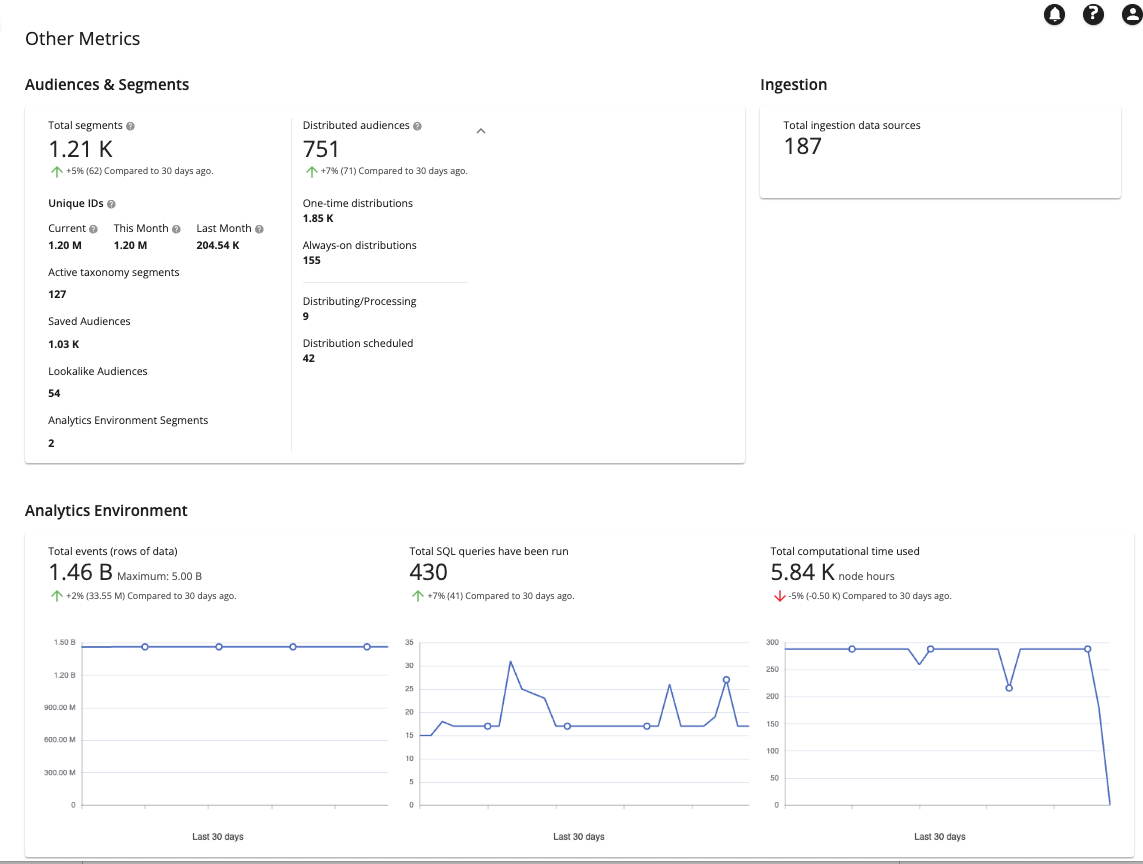
Audiences & Segments
Total segments: Includes only active taxonomy segments, audiences, Advanced Audience Builder segments, and Analytics Environment segments. "Total segments" corresponds to the number of "Segments Under Management" in Customer Profiles for this account:
The top number represents the current daily total number.
The comparison number shows the percentage change in the daily total compared to the daily total number 30 days ago.
"Segments Under Management" is defined as the total number of segments in Customer Profiles for Data Collaboration at a given time. Safe Haven's usage dashboards calculate it as follows:
Segments Under Management = AAB + AE + Seed + Modeled + Active Taxonomy + Saved Segments
Where:
A segment is defined as a key-value pair (e.g., Color=green would be one segment).
AAB refers to segments created or used in Advanced Audience Builder that are also in the active taxonomy.
AE refers to segments created or used in Safe Haven Analytics Environment that are also in the active taxonomy.
Seed refers to the seed segment used to create lookalike models.
Modeled refers to segments in the created lookalike-modeled audiences.
Active Taxonomy refers to segments in the taxonomy that is set to Active.
Saved Segments refers to segments in the audiences created with Audience Builder.
Unique IDs: The total number of unique IDs in Customer Profiles for this account. A unique ID is an identifier for the deduplicated records of a single customer.
Current: The maximum number of unique IDs at the end of the previous day.
This Month: The maximum number of unique IDs from the beginning of the current calendar month to the previous day. On the first day of the calendar month, the maximum number of unique IDs will not display until the end of the day.
Last Month: The maximum number of unique IDs for the previous calendar month.
Active taxonomy segments: The number of active taxonomy segments.
Saved Audiences: The number of saved audiences.
Lookalike Audiences: The number of lookalike-modeled audiences.
Analytics Environment Segments: The number of Analytics Environment segments.
Distributed audiences: The total number of audiences that have been distributed successfully.
One-time distributions: The number of audiences that have been distributed successfully once and are not set up for Always-On refreshes (One-Time).
Always-on distributions: The number of audiences that have been distributed successfully once and are set up for Always-On refreshes.
Distributing/Processing: The number of audiences that are being distributed for the first time (One-Time + Always-On).
Distribution scheduled: The number of audiences that are scheduled to be distributed in a future date (One-Time + Always-On).
Ingestion
Total ingestion data sources: Indicates the number of BigQuery tables in the Analytics Environment.
Analytics Environment
Total events (rows of data): The current daily total rows of data ("events") in your Analytics Environment account.
The comparison number shows the percentage change in the daily total compared to the daily total number 30 days ago.
The graph shows the daily totals for the last 30 days.
The number of "events" includes both rows of event-based data (such as transaction or exposure data) or non-event-based data, such as CRM data.
If you permission data to a partner tenant, their partner tenant dashboard will only reflect their first-party data, not your data.
Total SQL queries that have been run: The cumulative month-to-date total number of SQL queries that have been run in BigQuery in your Analytics Environment account.
The comparison number shows the percentage change compared to the total number 30 days ago.
The graph shows the daily totals for the last 30 days.
Total computational time used: The total amount of computational time used in your Analytics Environment account.
The top number represents the cumulative month-to-date total for the current calendar month.
The comparison number shows the percentage change compared to the total number 30 days ago.
The graph shows the daily totals for the last 30 days.
Note
A minimum of approximately 288 hours of computational time per day per account is always being used (so approximately 9000 hours per month), even when you are not doing any processing. Take these numbers into account when assessing your node hours.
If you have partner tenants connected to your account, you can view usage metrics for those partner tenants' accounts on the All Usage Dashboards page.
Note
Only users with the LSH Admin or LSH CP Admin personas have access to the All Usage Dashboards page.
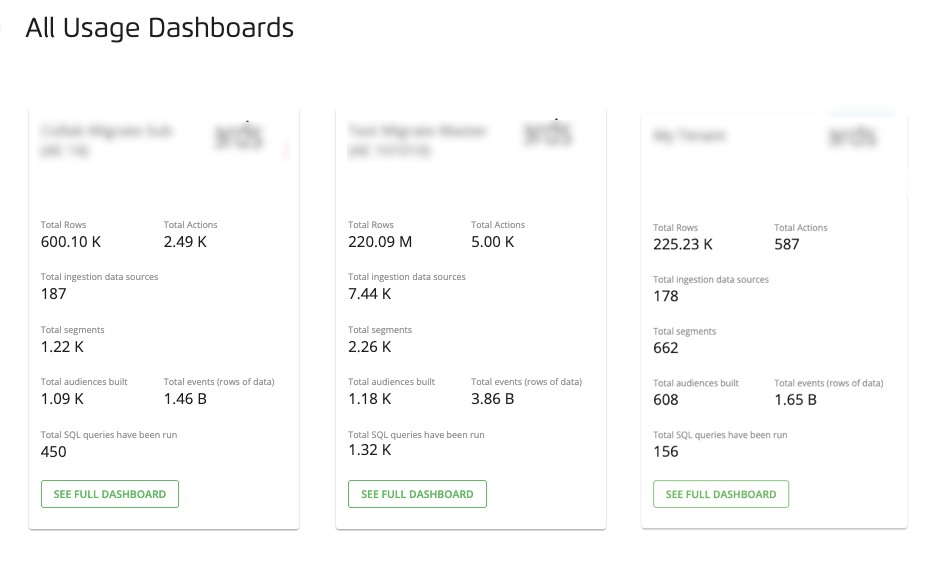
Tiles appear for your account and for any partner tenant accounts that are associated with your account.
In the left navigation bar, click All Usage.
The All Usage Dashboards page displays account tiles with a high-level summary of the current usage for the account. The first tile is the primary tenant's. The following metrics are displayed on account tiles:
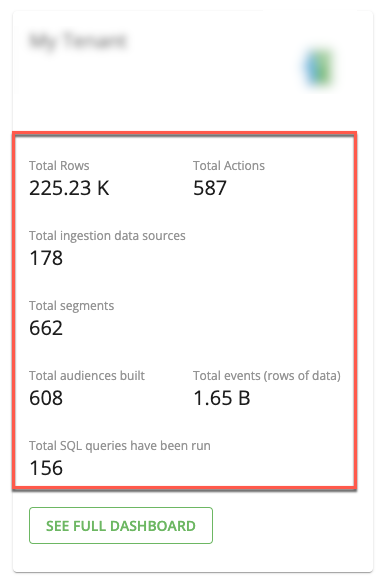
For information on what each metric represents, see “Definition of Billable Metrics Displayed” and “Definition of Other Metrics Displayed” sections.
To see the full dashboard for the partner tenant account (including user counts), click .
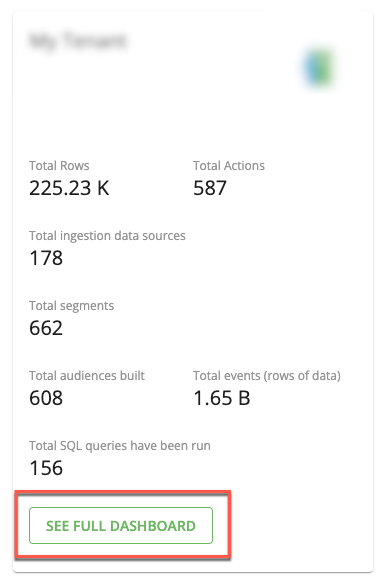
The full dashboard for the partner tenant account is displayed.