View Audience Insights
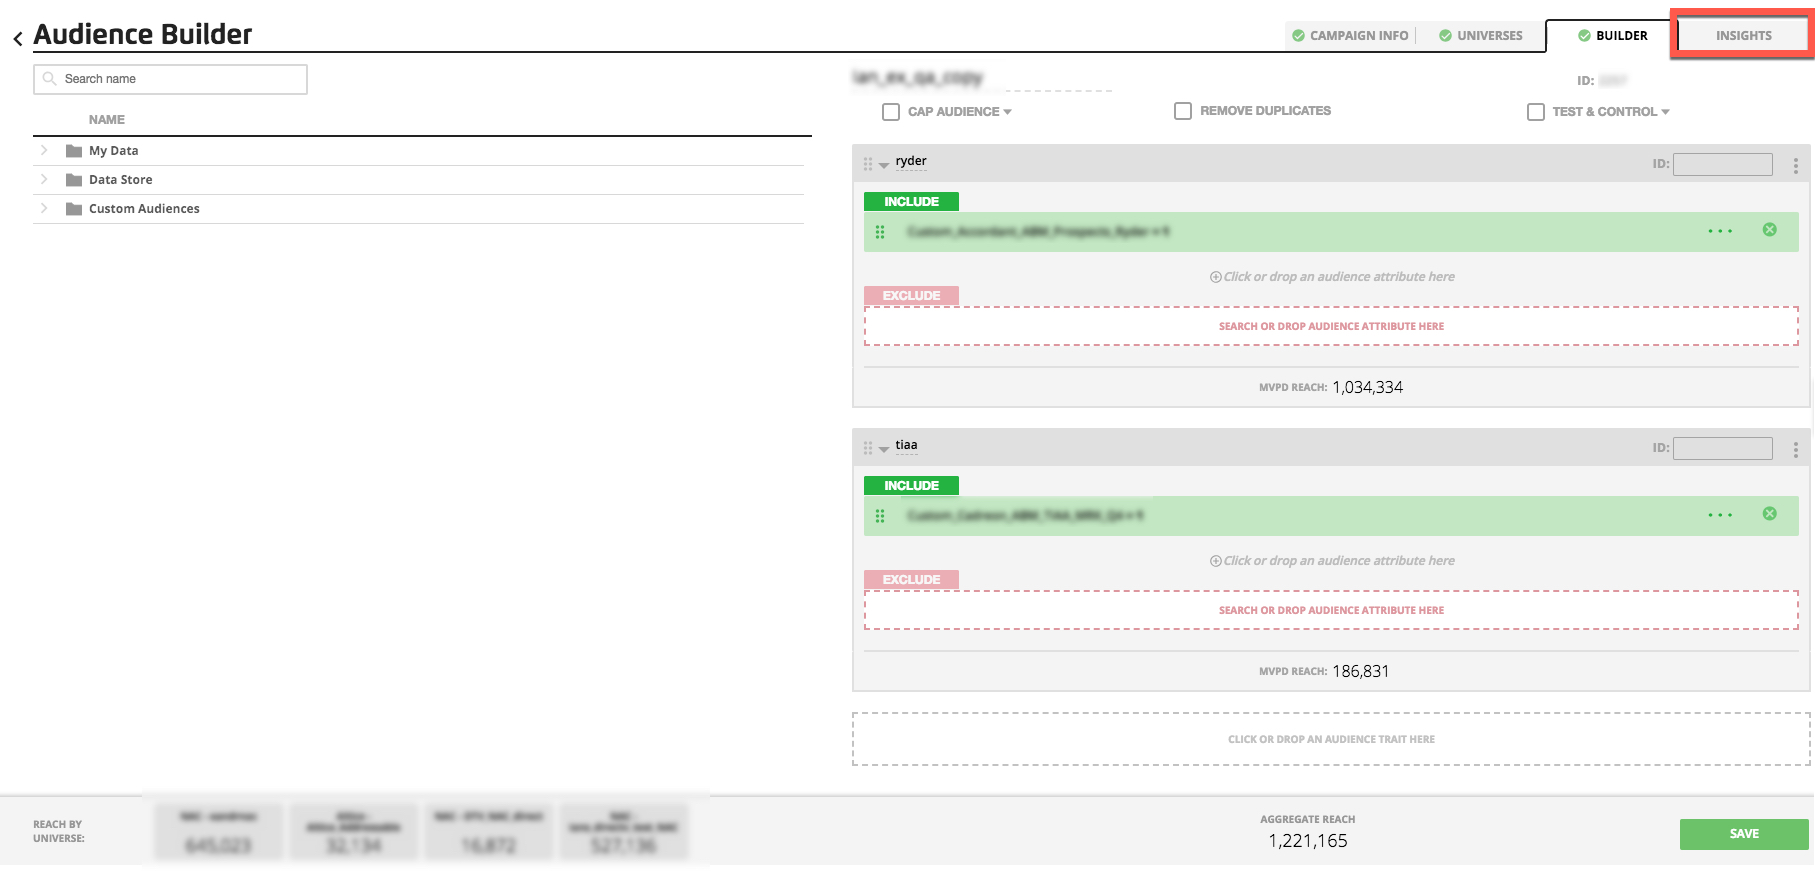
To see data visualizations and additional details about an audience you’re building, select the Insights tab on the Audience Builder page during the audience-building process.
Note
If the audience has already been built, edit the audience and then select the Insights tab on the Audience Builder page.
To see audience insights for an audience that was built by someone else, first duplicate the audience and then edit the duplicated audience.
The Insights tab has two possible components:
Audience Composition: This component provides visualizations of audience reach information broken down by universe, segment, and OTT devices (if an OTT universe has been included in the audience).
Audience Ranker: If this feature has been enabled for your account, the Audience Ranker allows you to see the number of subscribers or viewers in that custom audience that have a particular subscriber attribute. Whether you are planning a national campaign or wanting to identify specific geographies, use the ranker to obtain insights on where your target audience indexes the highest.
Use the caret symbol (>) in each component’s panel to expand or collapse the component.
You can view Insights either during the audience building process or after the audience has been built (by editing the audience). From anywhere within the Audience Builder page, select the Insights tab.
Note
Want the Audience Ranker? Contact your LiveRamp representative to opt-in for this component.
View Audience Composition Information
From anywhere within the Audience Builder page, select the Insights tab.
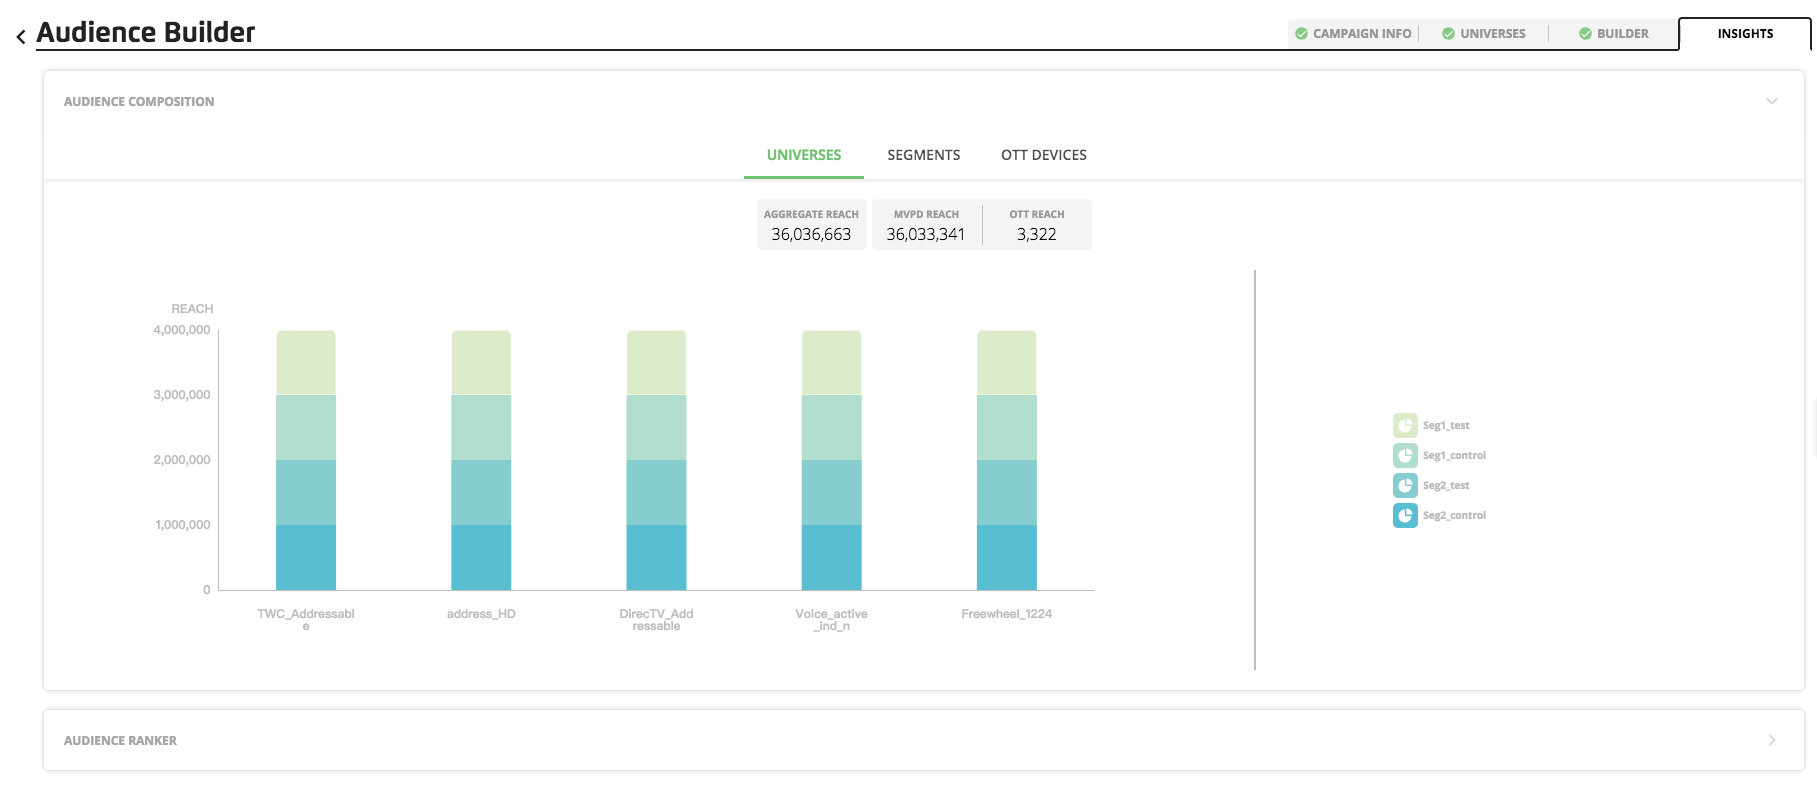
The Audience Composition panel opens and displays reach data and graph information (depending on which tab is selected).
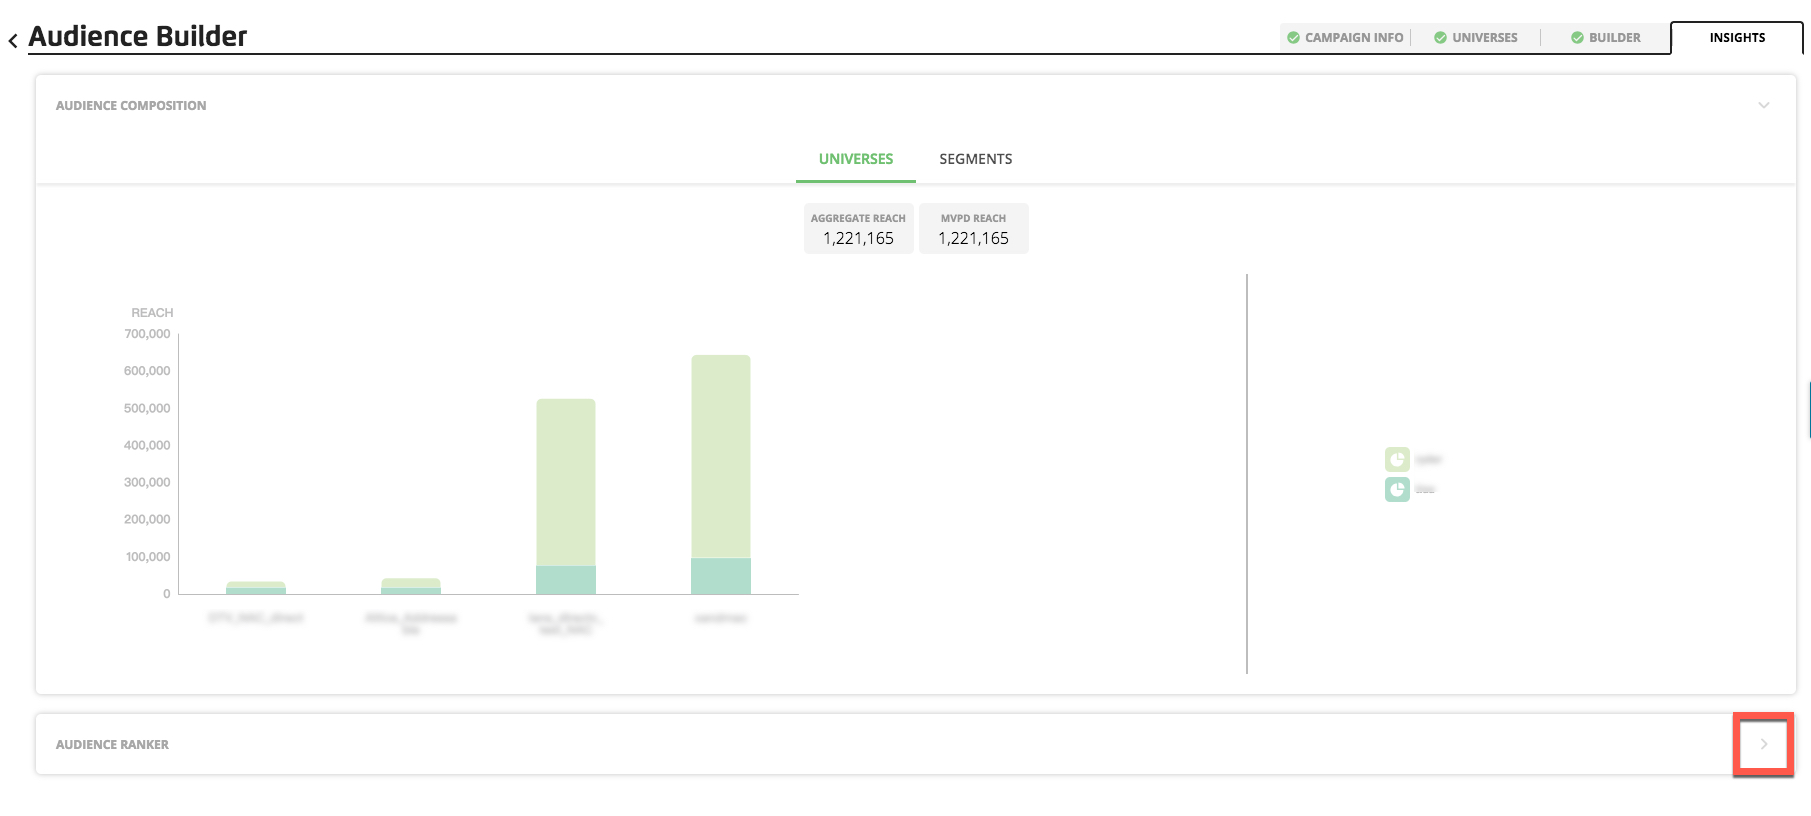
The Universes Tab
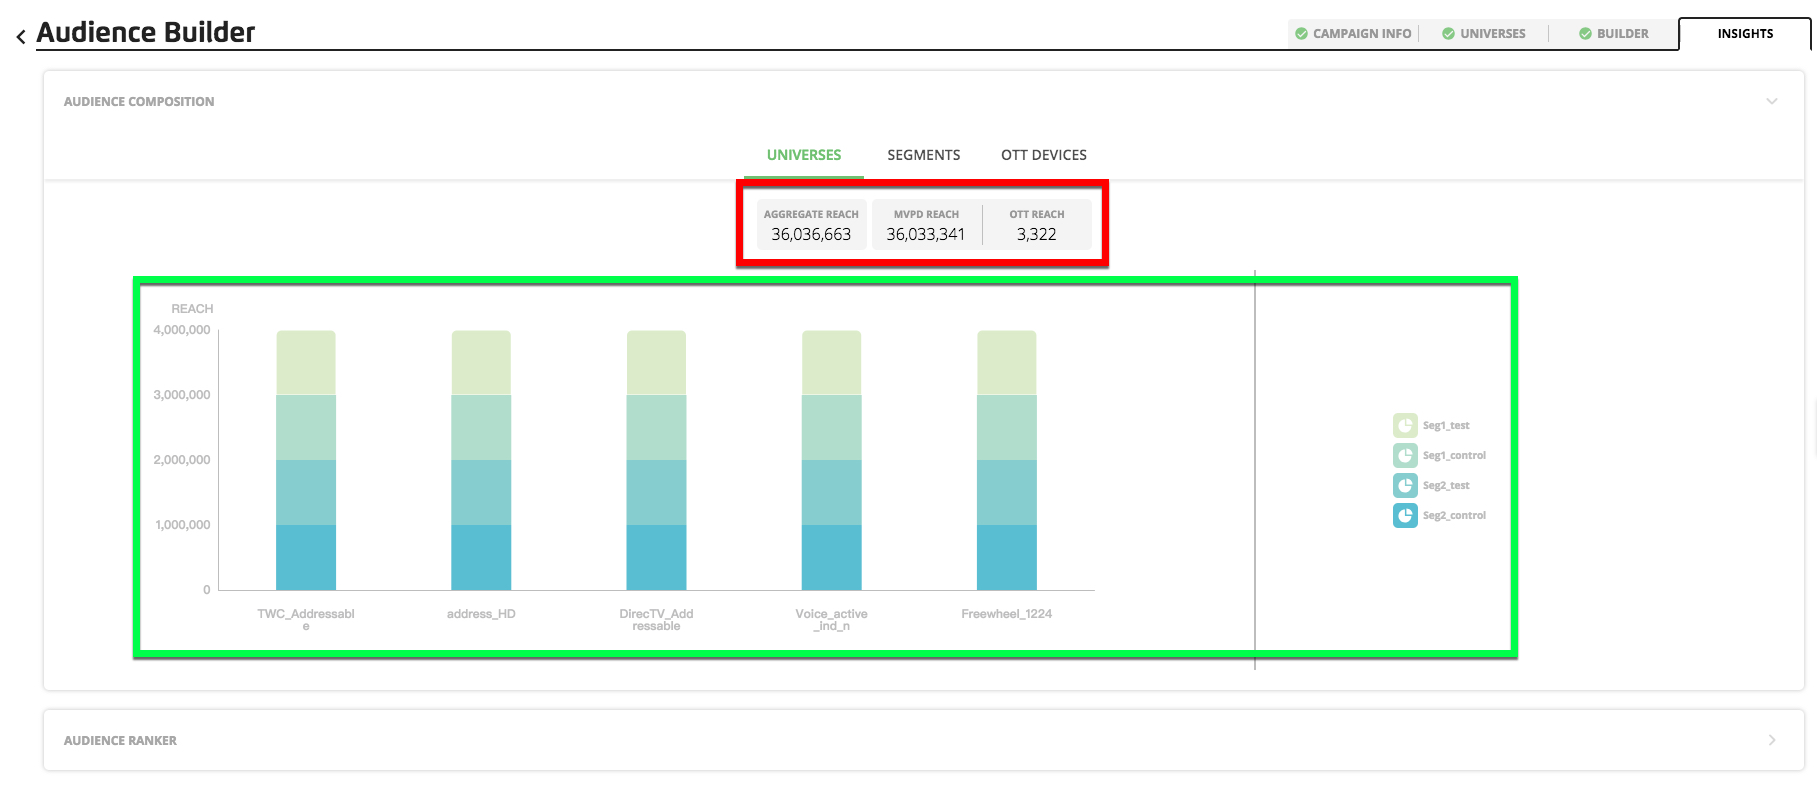
The header area (the red box) shows audience-level reach data: aggregate reach, MVPD reach (if the audience contains one or more MVPD universes), OTT reach (if the audience contains one or more OTT universes), households (if household counts have been enabled), and unassociated OTT (if household counts have been enabled).
The graph area (the green box) shows the segment counts in each universe, with each segment represented as a different color (the color assignment is displayed in the right-side panel). Hover over an individual segment in the graph to see the specific count for that segment in that universe.
If no universes have been selected, the panel displays “No data to display”.
The Segments Tab
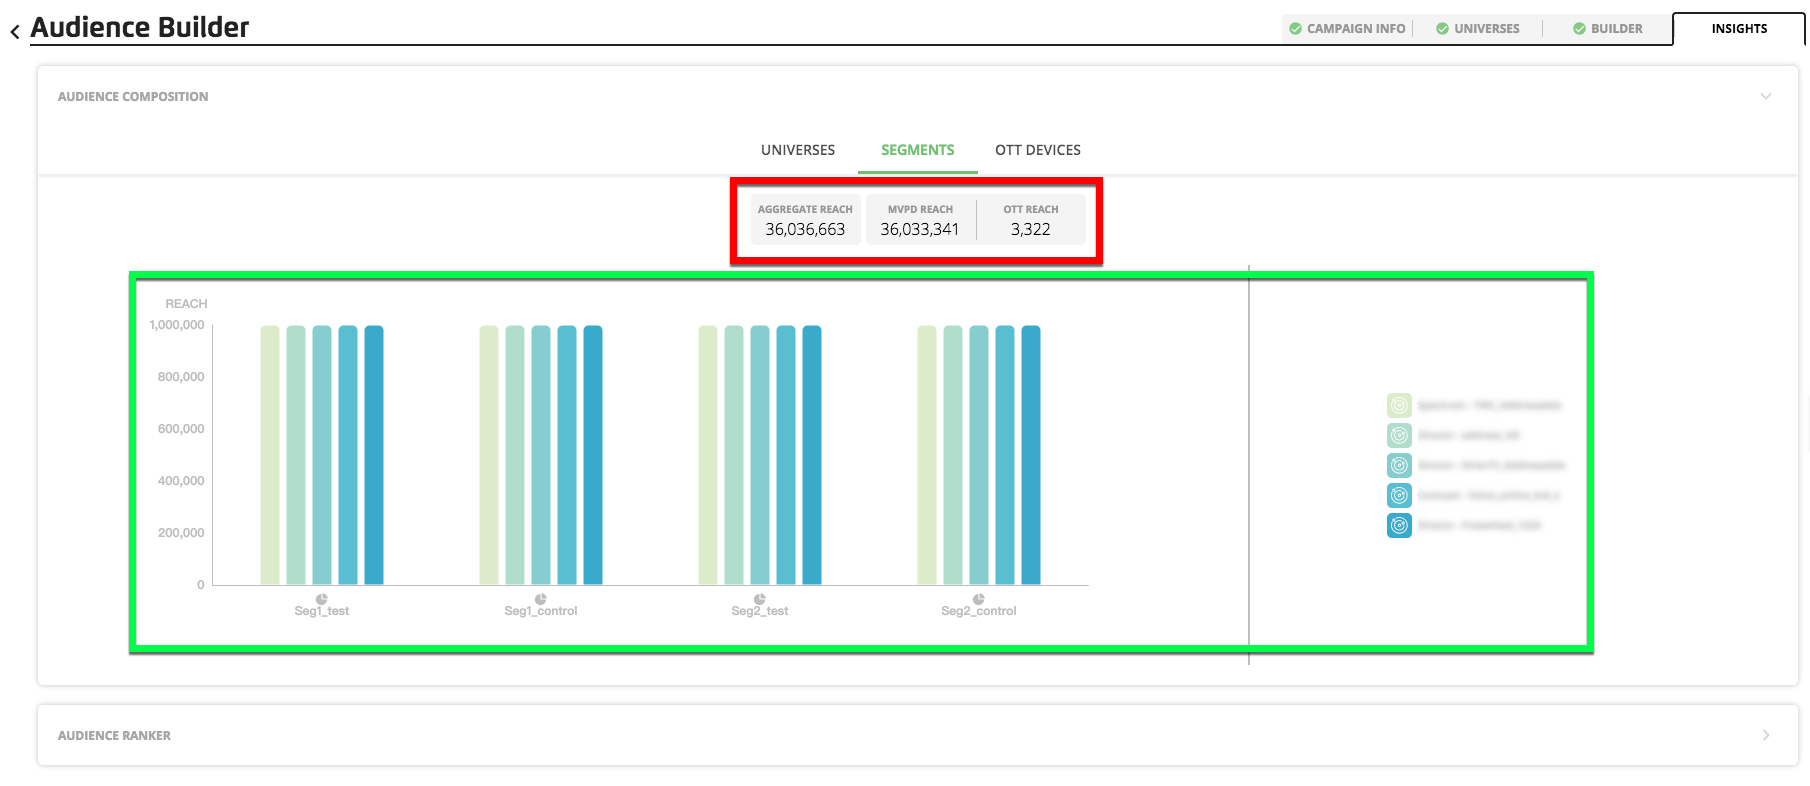
The header area (the red box) shows audience-level reach data: aggregate reach, MVPD reach (if the audience contains one or more MVPD universes), OTT reach (if the audience contains one or more OTT universes), households (if household counts have been enabled), and devices (if device counts have been enabled).
The graph area (the green box) shows the universe count in each segment, with each universe represented as a different color (the color assignment is displayed in the right-side panel). Hover over an individual universe in the graph to see the specific count for that universe in that segment.
If no segments have been created, the panel displays “No data to display”.
The OTT Devices Tab
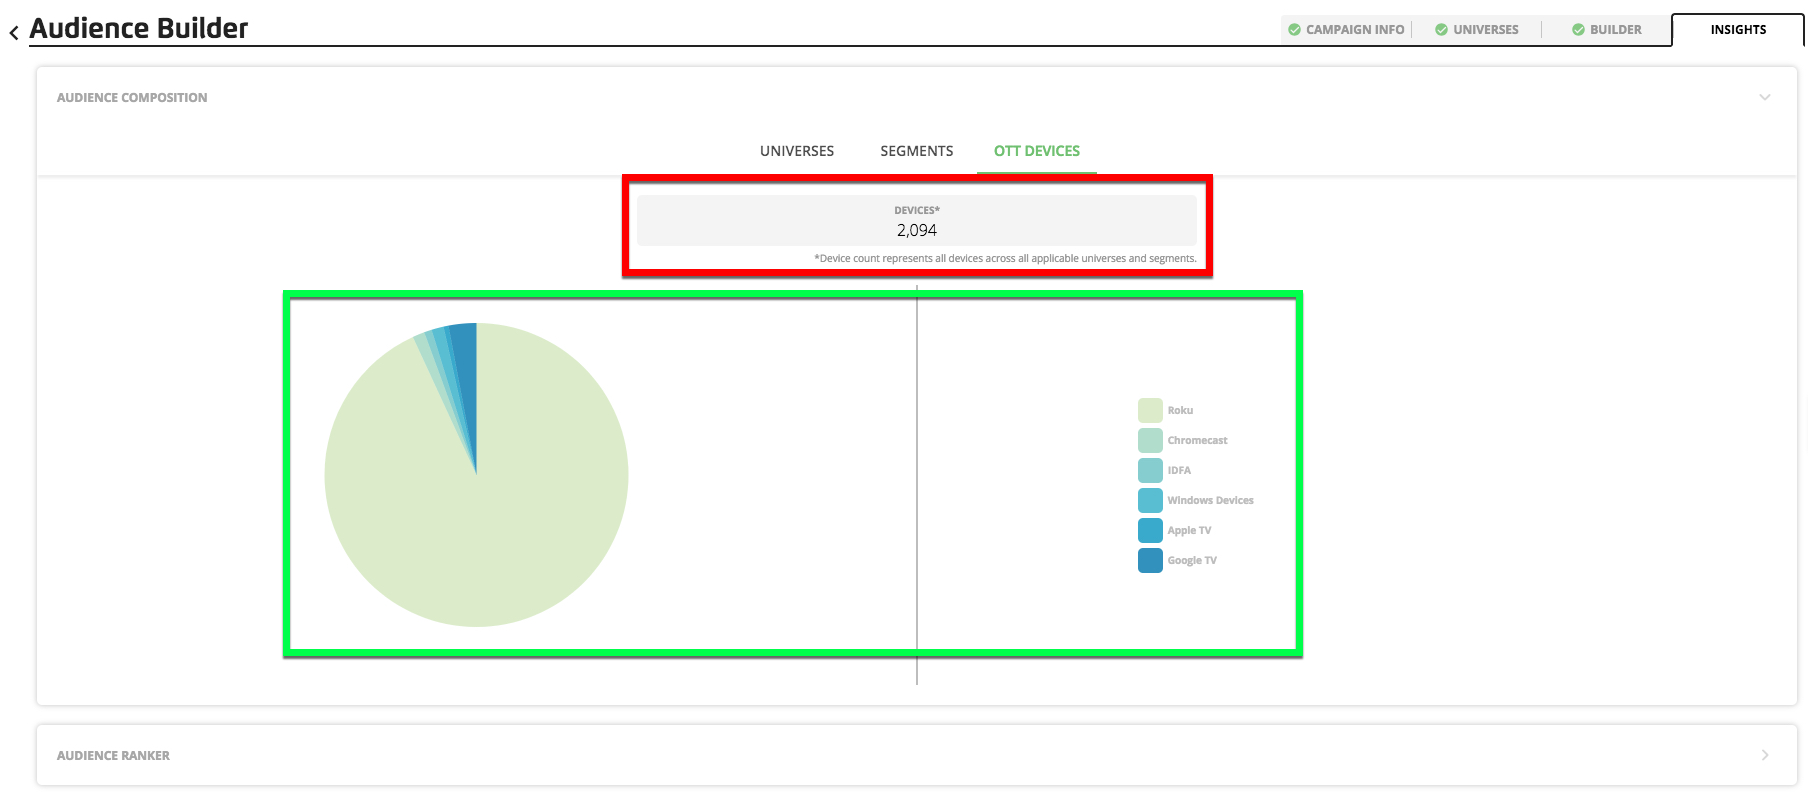
Note
If the audience does not include an OTT universe, this tab will not appear.
The header area (the red box) shows the count of OTT devices in the audience.
The graph area (the green box) shows the count breakdown for each device type that the selected universe supports. Hover over an individual device type in the graph to see the specific count for that device type in that universe. Note: If the same device ID appears in multiple universes, that device will only be counted once.
Threshold Warnings
If the audience count is below one or more universe’s audience threshold, or if one or more segments are below one or more universe’s segment threshold, a warning appears under the header bar and at the appropriate location in the graph area (depending on which view is being used).
Use the Audience Ranker
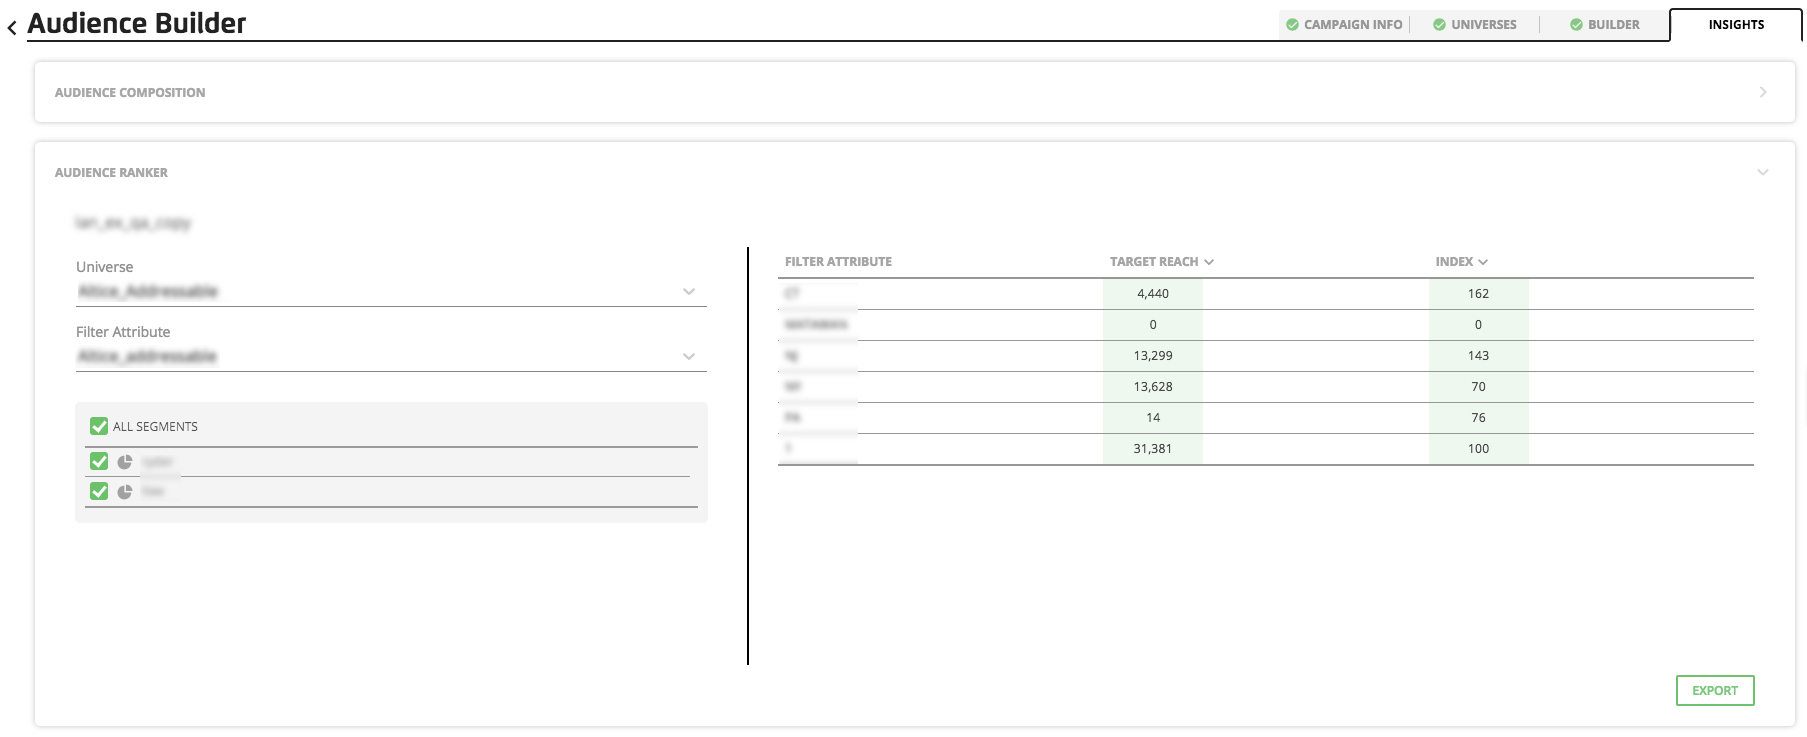
From the Insights tab, click the caret symbol (>) in the Audience Ranker panel to expand the panel.
Note
If desired, you can also click the caret symbol in the Audience Composition panel to collapse that panel.
On the left panel, click into the Universe dropdown and select the desired universe.
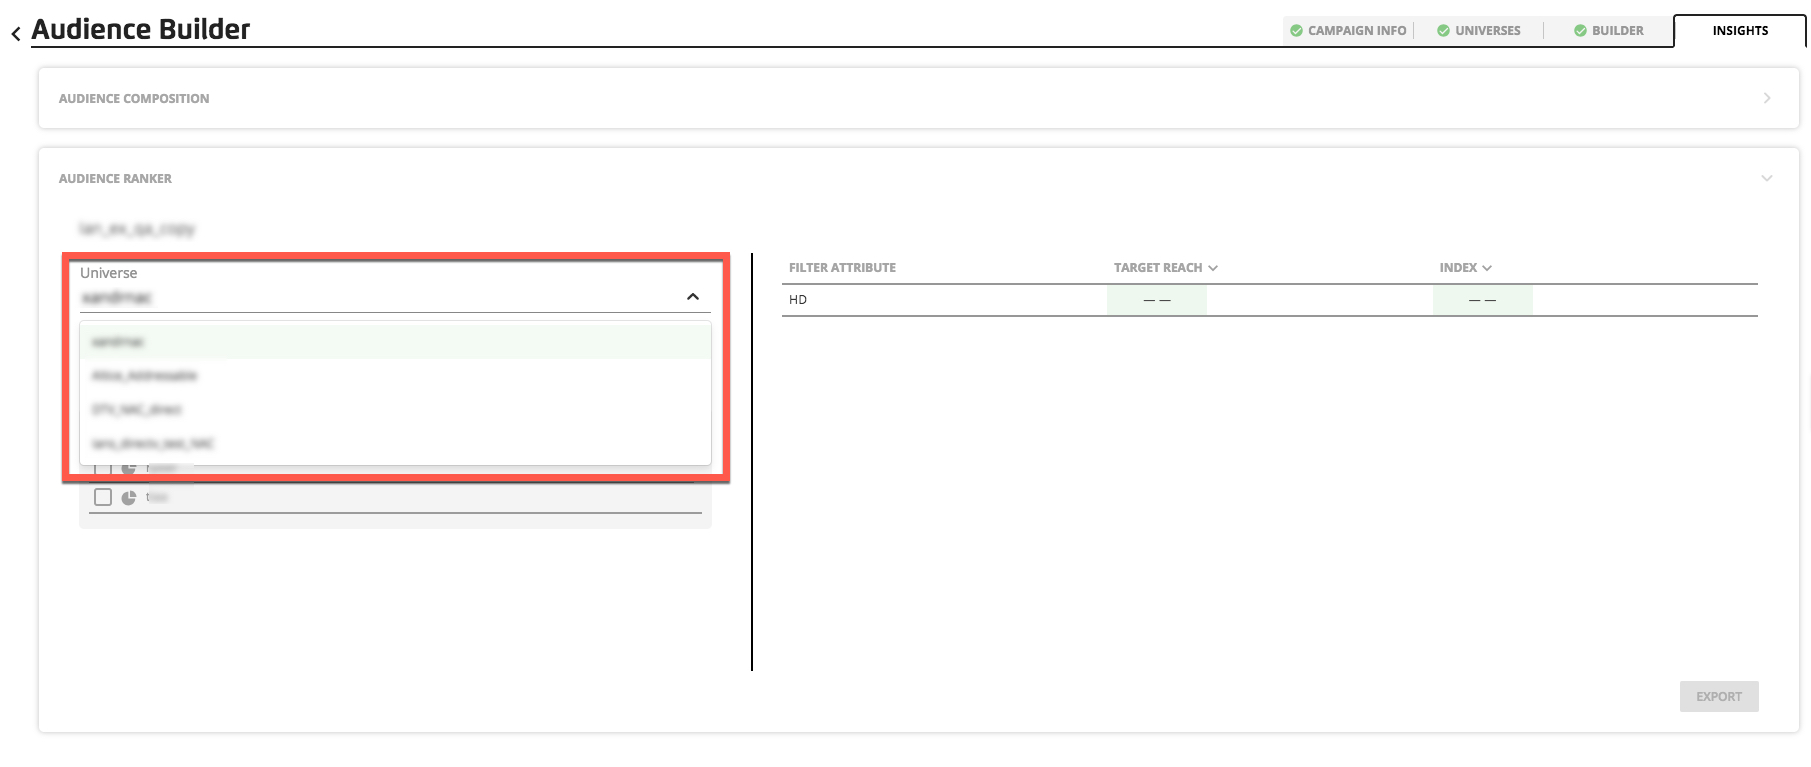
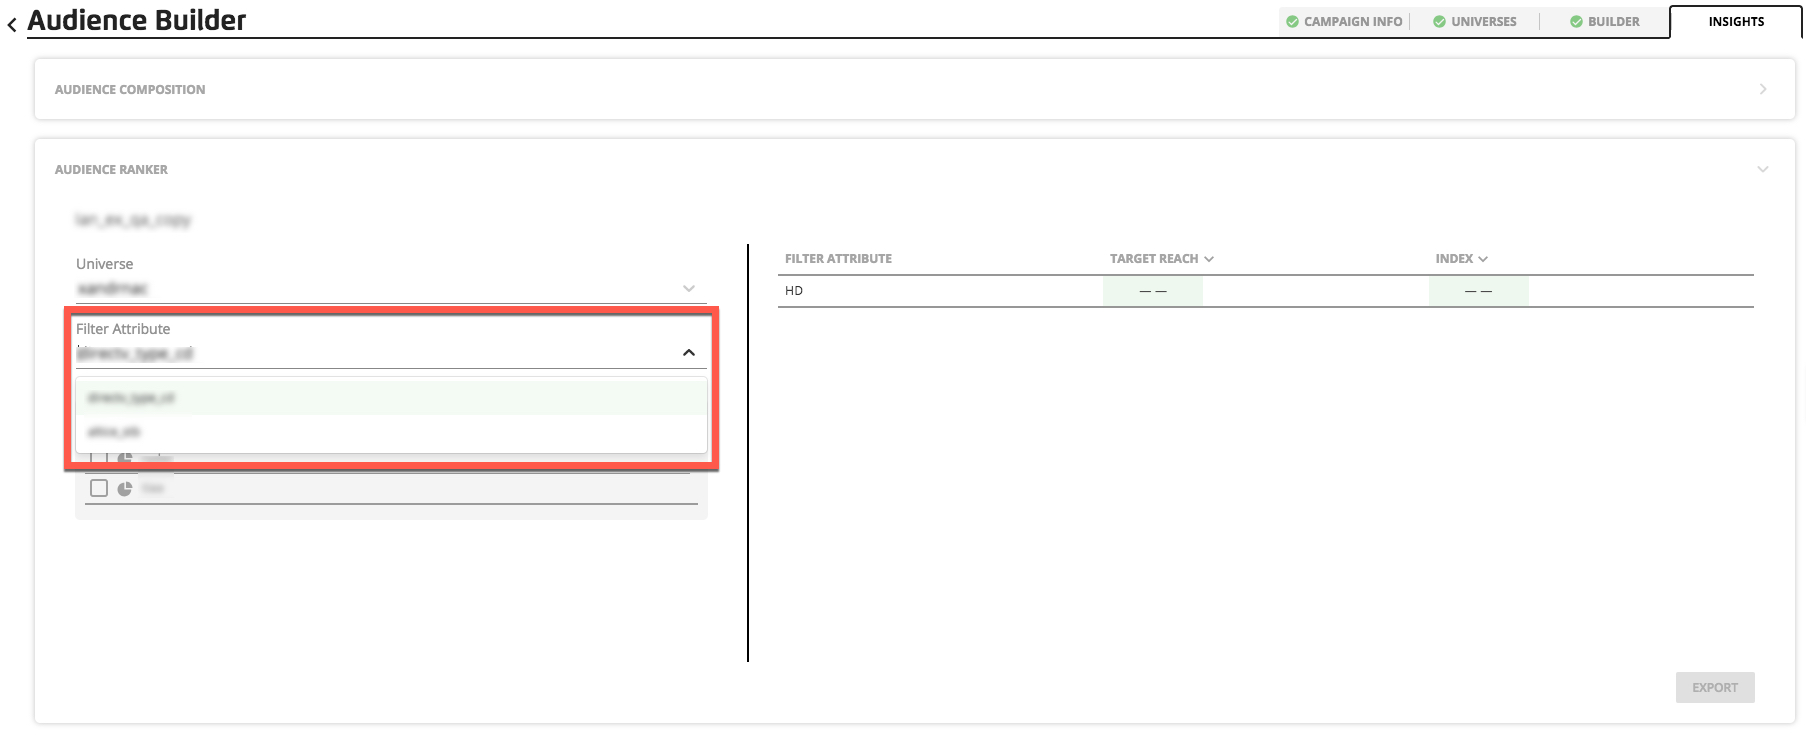
Click into the Filter Attribute dropdown and select the desired filter attribute from the attributes that are attached to the selected universe.
Check the check boxes for the segments for which you’d like the breakdown (or check the “ALL SEGMENTS” check box to see a breakdown for all segments).
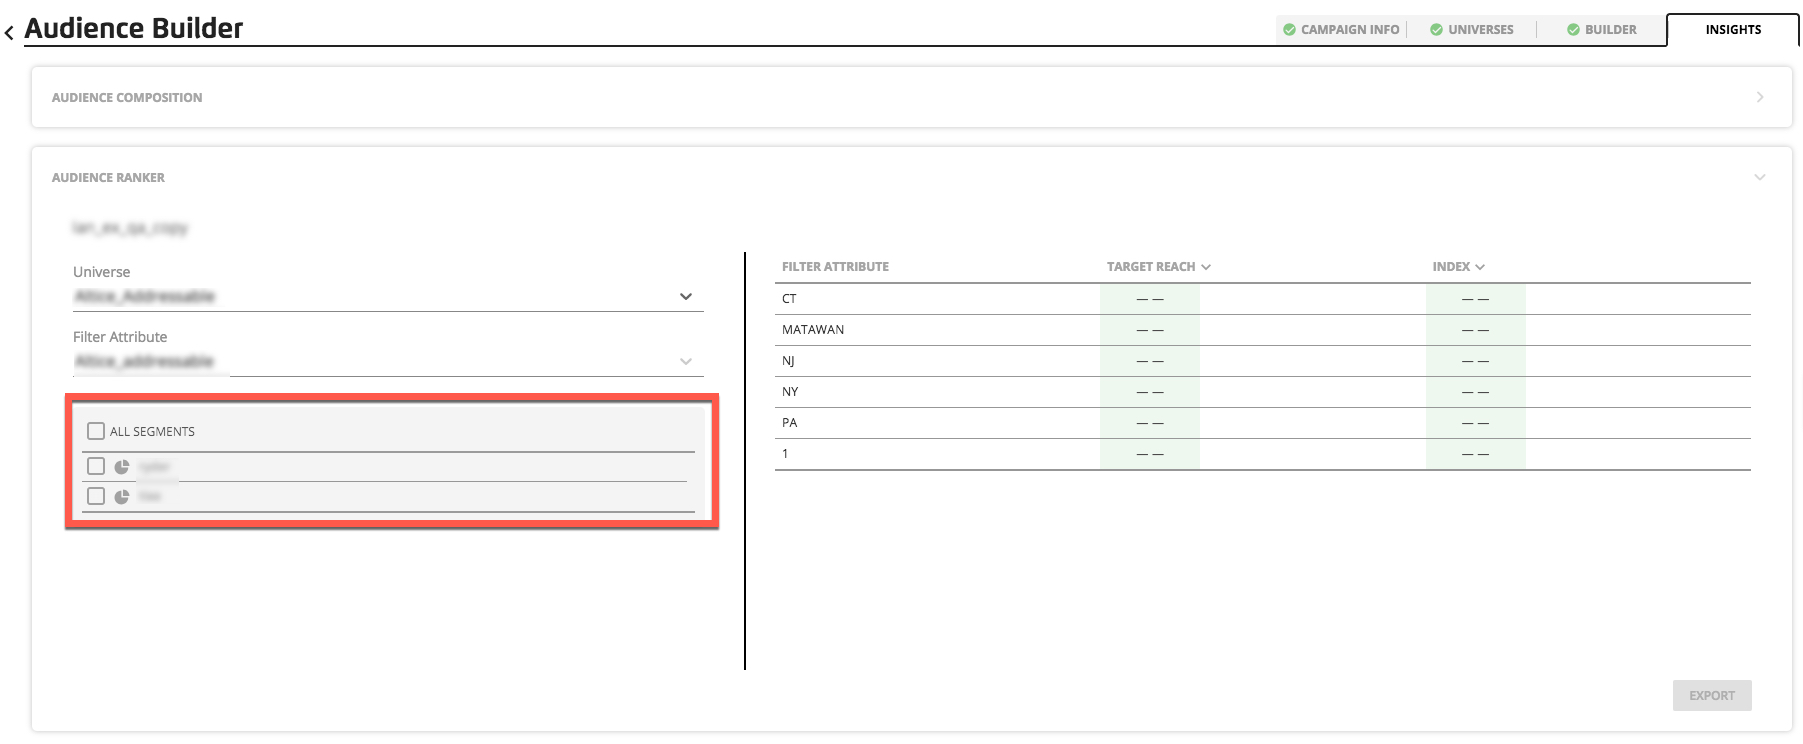
The target reach and index calculation displays for each attribute.
To change the sort order and priority, click the arrows to the right of the TARGET REACH and INDEX column headings.
To change the view, switch between universes, attributes, and segments.
When finished, select any other tab to navigate to a different area of the Audience Builder page.
Exporting Audience Ranker Data
To export Audience Ranker data for use in geo-based data-driven linear campaigns (in accordance with the pricing schedule in your contract), click Export at the bottom of the page.
You must have at least one segment checked to be able to download insights. Just like the UI, the export aggregates counts / index for all segments that are selected. If you have insights for two attributes, there will be two tabs, one for each attribute.
Caution
You may find discrepancies in Reach totals due to a household being tagged in more than one geo-zone.