Export Trends Dashboard
The Export Trends dashboard provides insights into export process trends over time. It lets you view and analyze several key metrics related to your export processes. These metrics can help you find trends in the content you export from your identity graph.
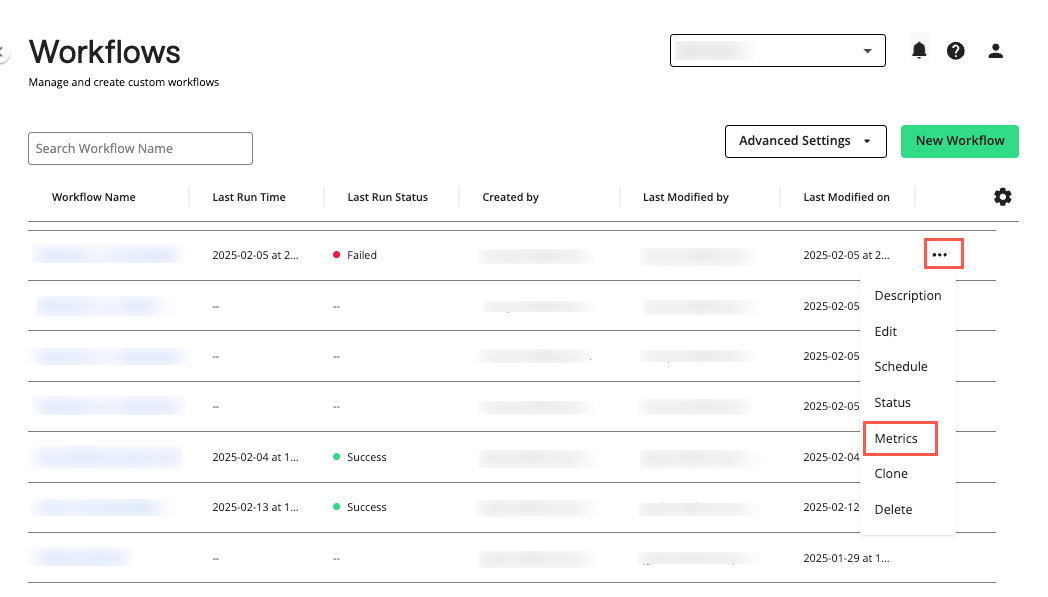
On the Workflows page, click the More Options menu (
 ) of the workflow you want to review and select .
Note
The “Metrics” option is unavailable for workflows that have not yet been run successfully.
The Graph Build Overview dashboard displays.
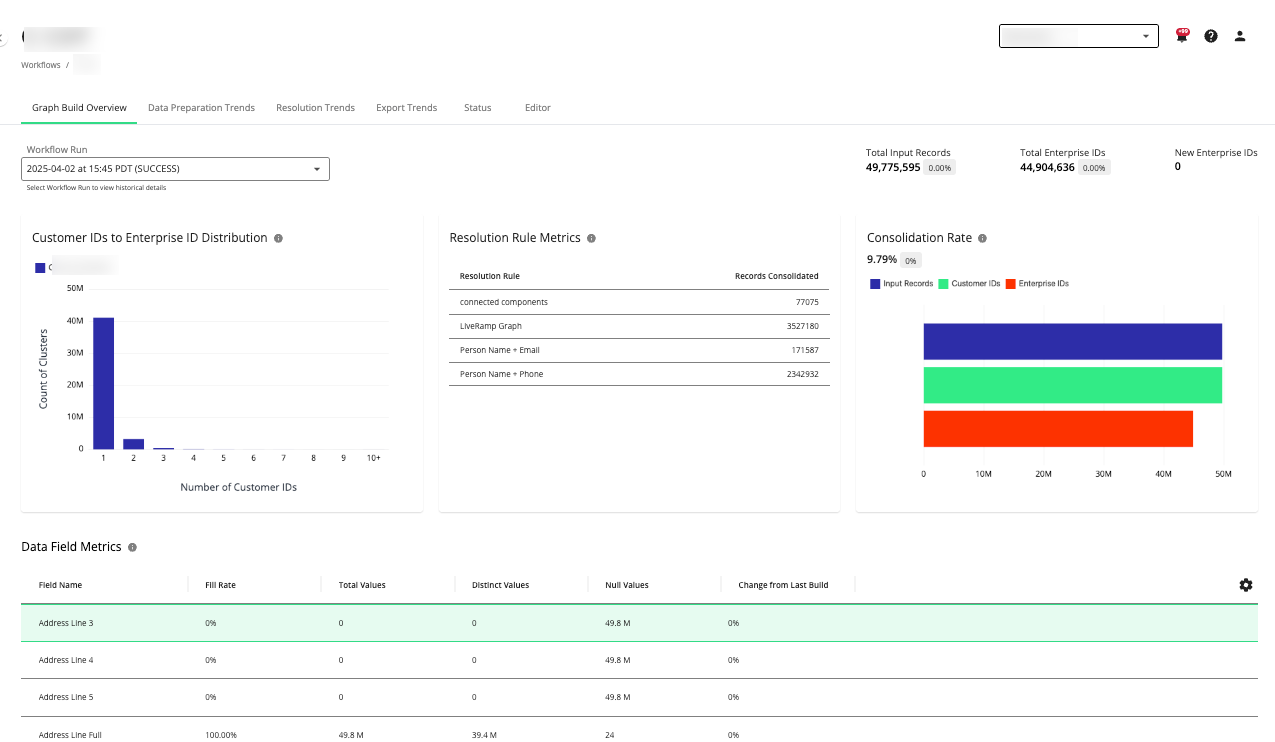
On the Graph Build Overview dashboard, select the tab.
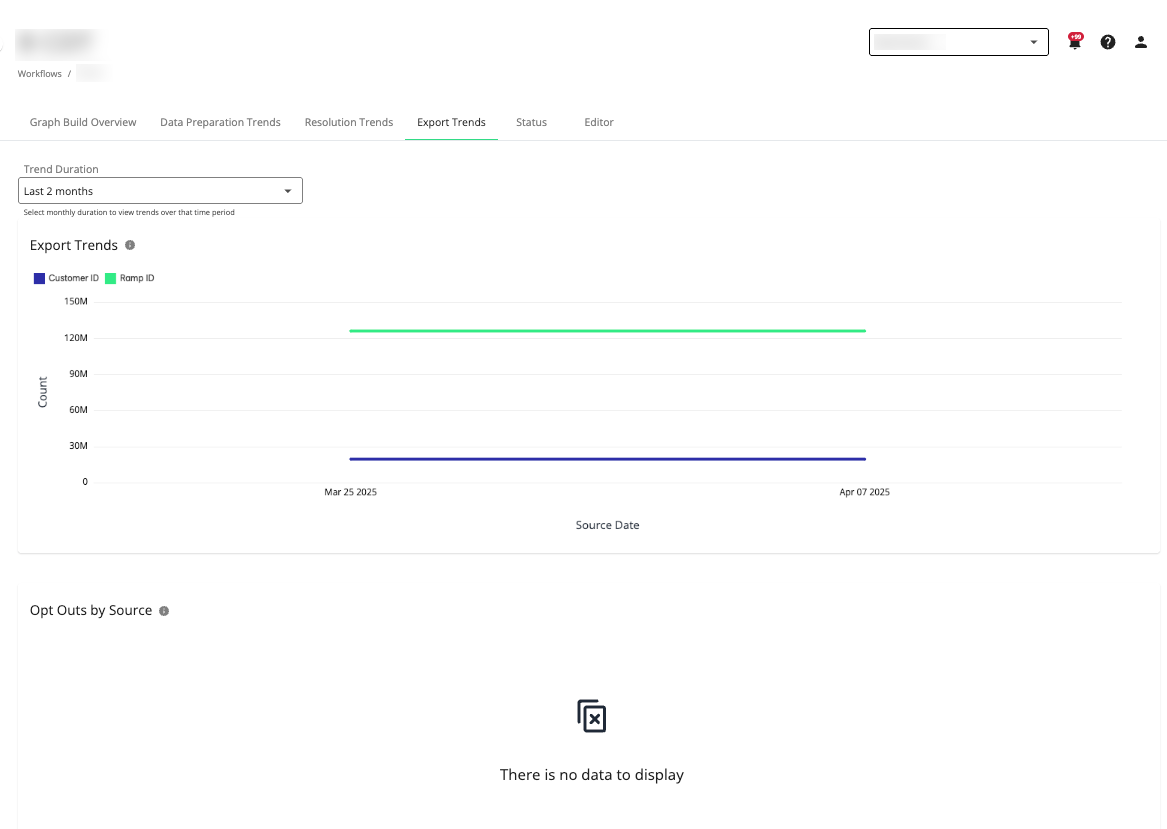
The Export Trends dashboard displays.
Actions You Can Perform on the Export Trends Dashboard
You can perform the following actions on the Export Trends dashboard page:
View metrics for export trends and opt-outs by source.
Adjust the time period in which to view export trends by selecting the number of months in the dropdown list.
Navigate to the Graph Build Overview, Data Preparation Trends, or Resolution Trends dashboards by selecting the desired tab.
View the workflow status by selecting the tab.
Edit the workflow by selecting the tab.
Export Trend Metrics
The following metrics are available on the Export Trends dashboard:
Note
Hover over the source data within a chart to display more details. To show or hide sources, click the corresponding source icons located at the top of each chart.
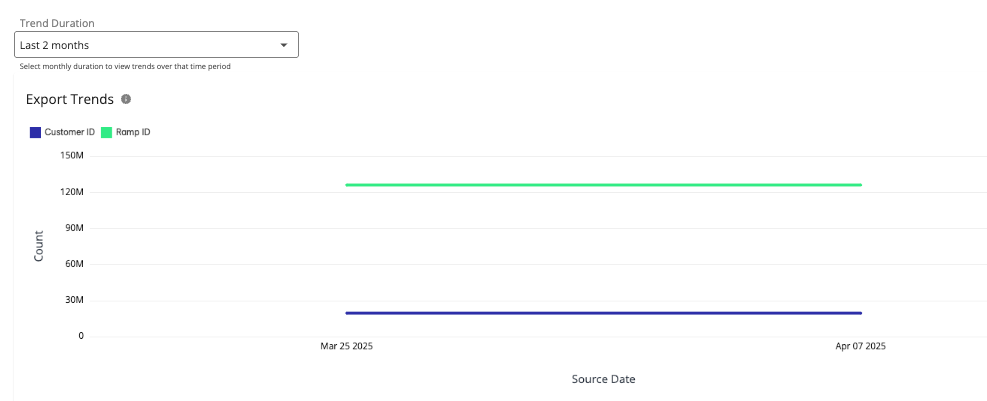
Export Trends
The “Export Trends” chart displays trends over time in the number of Customer IDs, Enterprise IDs, and Ramp IDs for each source date across identity graph builds. This indicates the completeness of information across Enterprise IDs and Ramp IDs. Typically, export trend numbers should remain fairly flat with only slight increases following the total input records trend (see “Total Input Records” on the “Graph Build Overview” tab).
Note
To adjust the trend duration, select the number of previous months from the dropdown list. You can select monthly intervals from the last 2 to 6 months.
Opt-Outs by Source
The “Opt-Outs by Source” chart displays the number of opt-outs from each source across different identity graph builds. Abrupt changes in opt-outs might indicate issues with source data. A large increase in opt-outs might indicate that a generic ID or placeholder value is being opted out, leading to an unexpectedly high count (e.g., opting out of a phone placeholder like “111-111-1111” could trigger many opt-outs).