Graph Build Overview Dashboard
The Graph Build Overview dashboard provides an overview of important metrics for each workflow run as you build and update your identity graph.
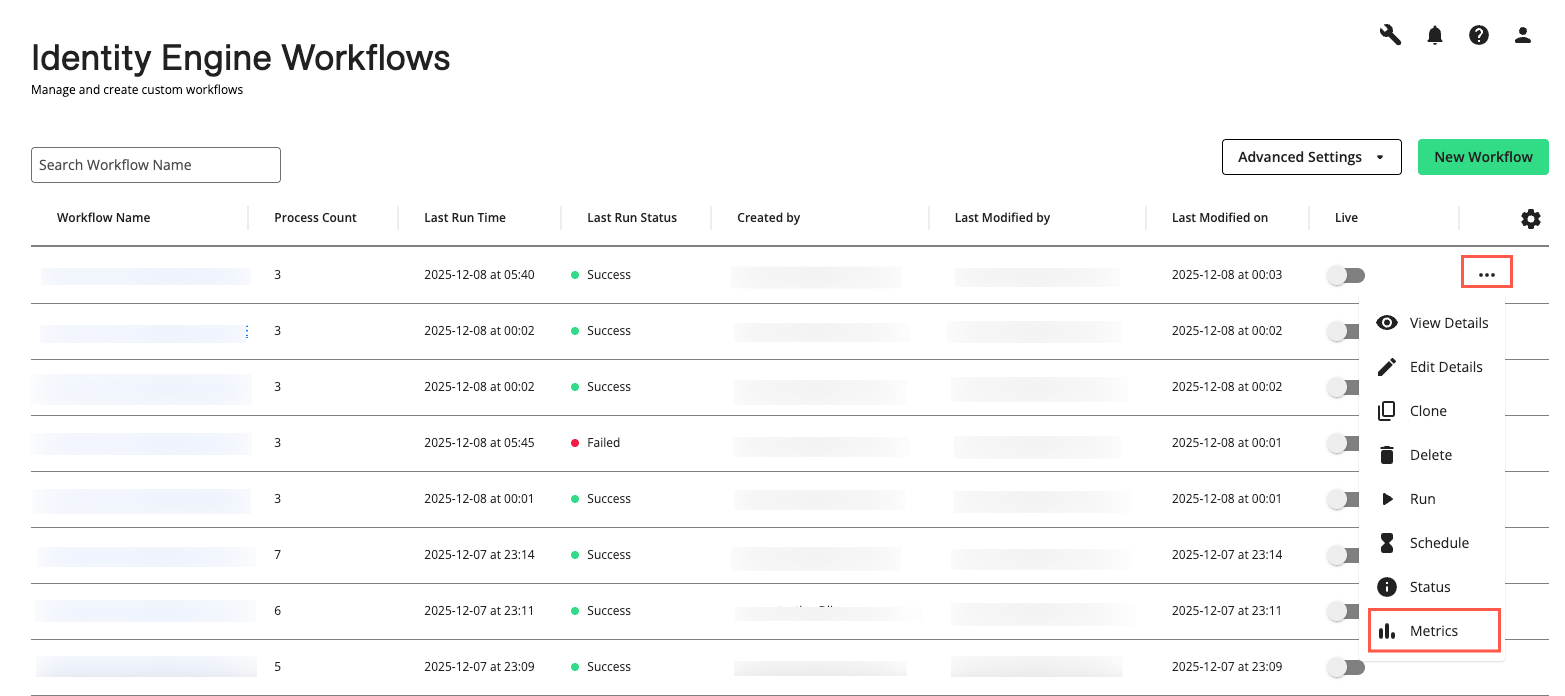
On the Workflows page, click the More Options menu (
 ) of the workflow you want to review and select .
Note
The “Metrics” option is unavailable for workflows that have not yet been run successfully.
The Graph Build Overview dashboard displays.
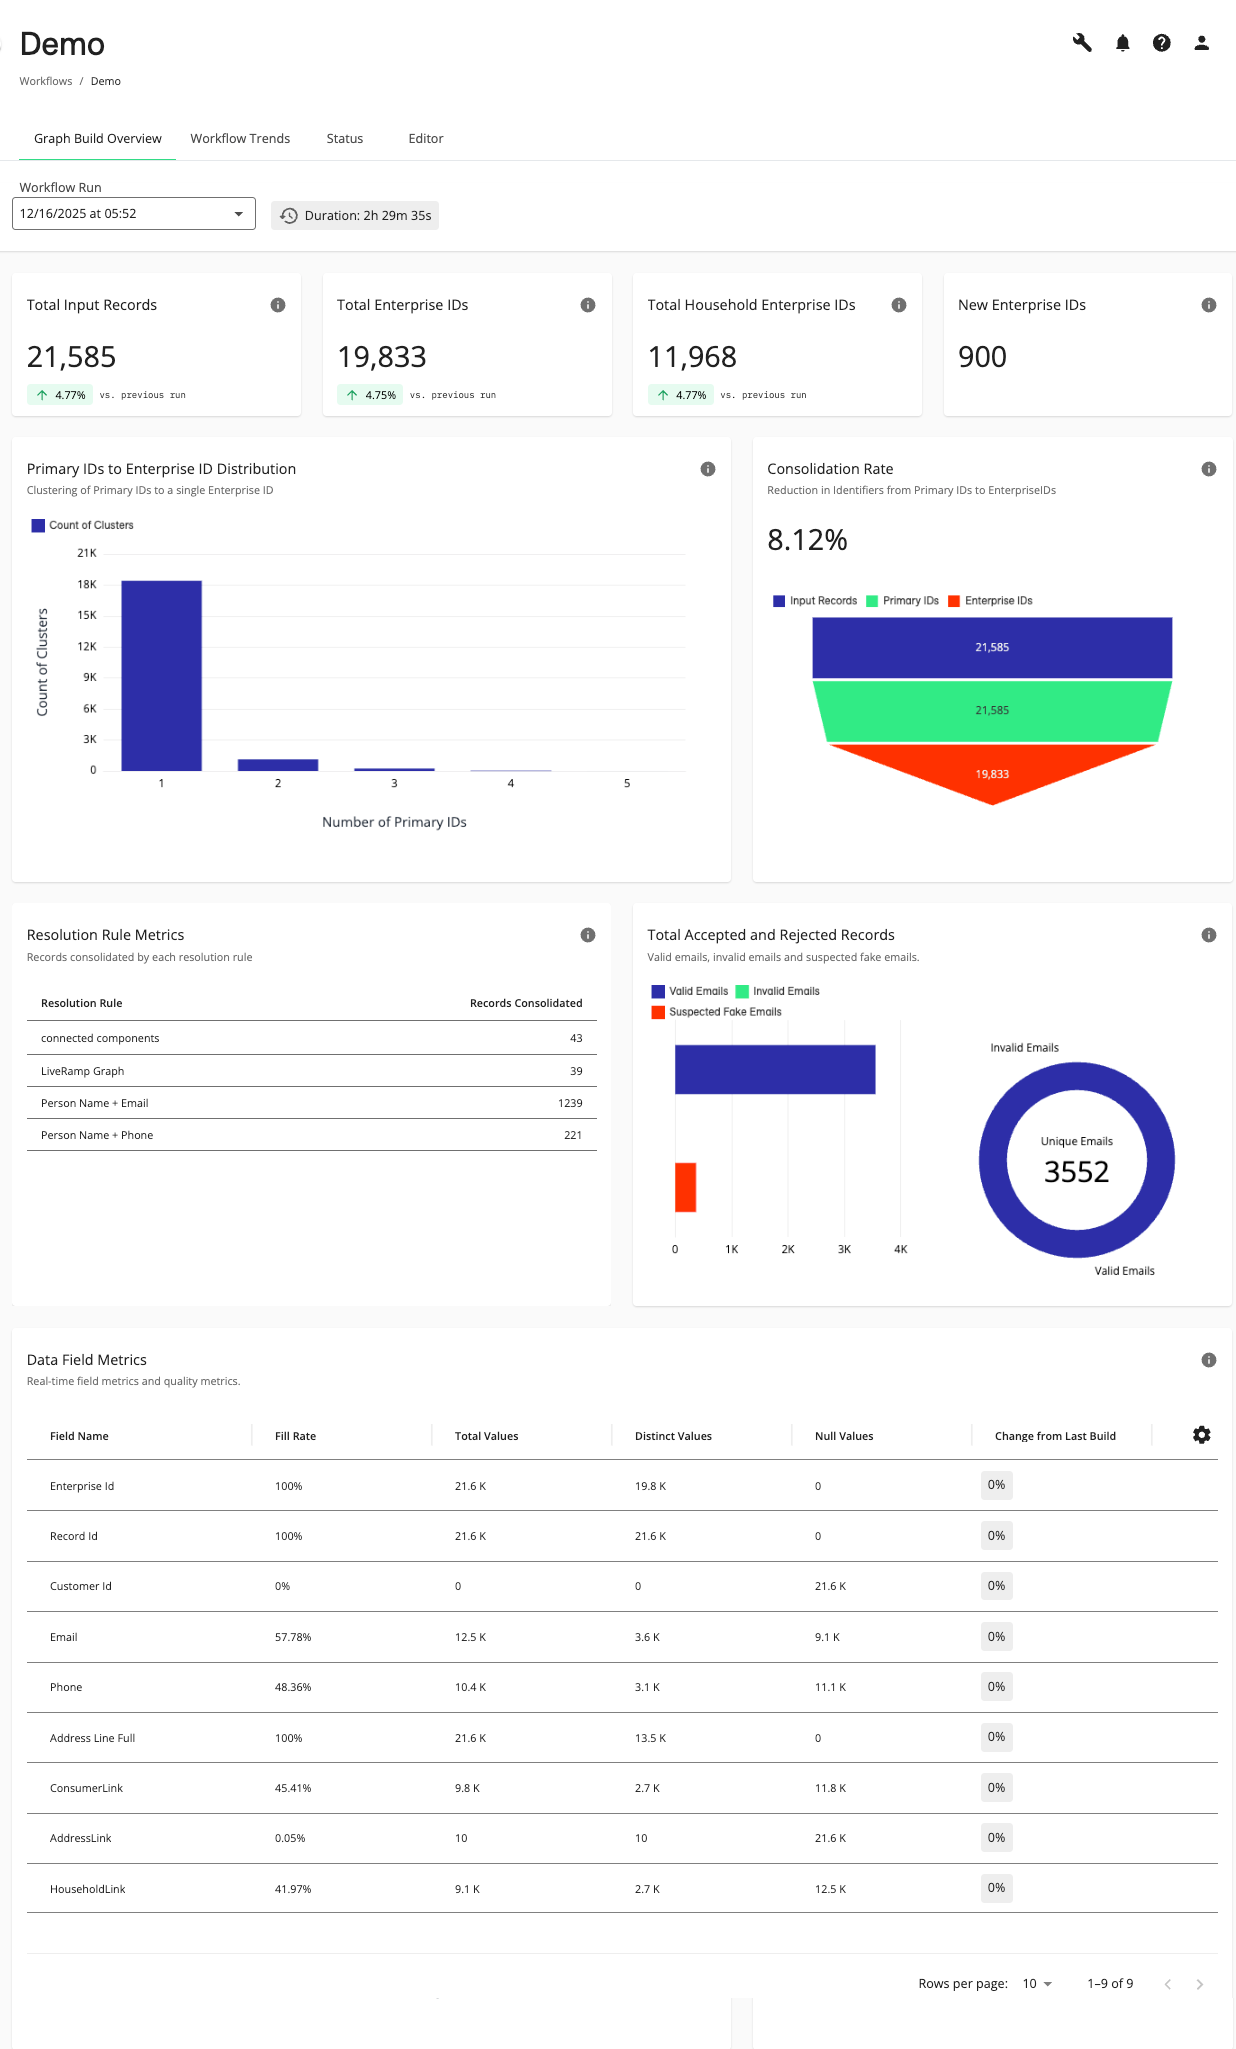
By default, the metrics for the most recently run workflow display. To view metrics for previous successful workflow runs, select the desired workflow from the drop-down list.
Actions You Can Perform on the Graph Build Overview Dashboard
You can perform the following actions on the Graph Build Overview dashboard page:
View “Total Input Records”, “Enterprise IDs”, “Household Enterprise IDs”, and “New Enterprise IDs”.
View “Primary IDs to Enterprise ID Distribution”, “Consolidation Rate”, “Resolution Rule Metrics”, “Total Accepted and Rejected Records”, and “Data Field Metrics” data for the selected workflow.
View metrics for previous successful workflow runs by selecting a previous run in the drop-down list.
View the Workflow Trends dashboard by selecting the Workflow Trends tab.
View the workflow status by selecting the tab.
Edit the workflow by selecting the tab.
Export the Graph Build Overview Dashboard metrics in PDF or CSV format.
Graph Build Overview Metrics
The following metrics are available on the Graph Build Overview dashboard:
Note
To see the metrics for any successful previously run workflows, choose the desired run from the drop-down list.
Total Input Records, Enterprise IDs, Household Enterprise IDs, and New Enterprise IDs
The total numbers of input records, Enterprise IDs, Enterprise Household IDs, and new Enterprise IDs are displayed for easy reference. The percentage change in total input records, Enterprise IDs, and Enterprise Household IDs is also displayed, comparing the current workflow run to the previous successful run. An up arrow ( ) indicates an increase, and a down arrow (
 ) a decrease in these numbers.
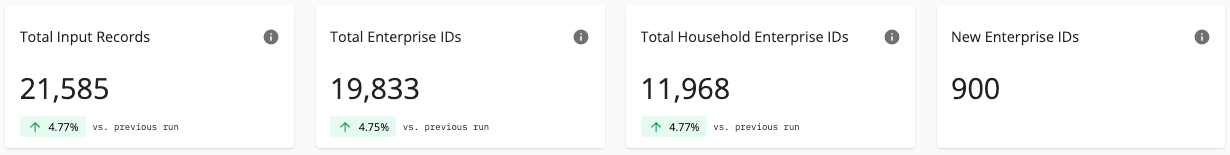
Generally, if you introduce new records into your data preparation processes, the percentage change of the "Total Input Records", "Total Enterprise IDs", and "Total Enterprise Household IDs" should show an up arrow() indicating a percentage increase (see above) from the previously run workflow. If any of these have an unexpected decrease () from the previously run workflow, you might need to investigate your data or process rules.
When adding or removing data sources, these numbers can provide guidance on how effective your processes are in consolidating your data to Enterprise IDs and Enterprise Household IDs. Large or unexpected changes in these numbers could indicate that your data sources or resolution processes need adjusting.
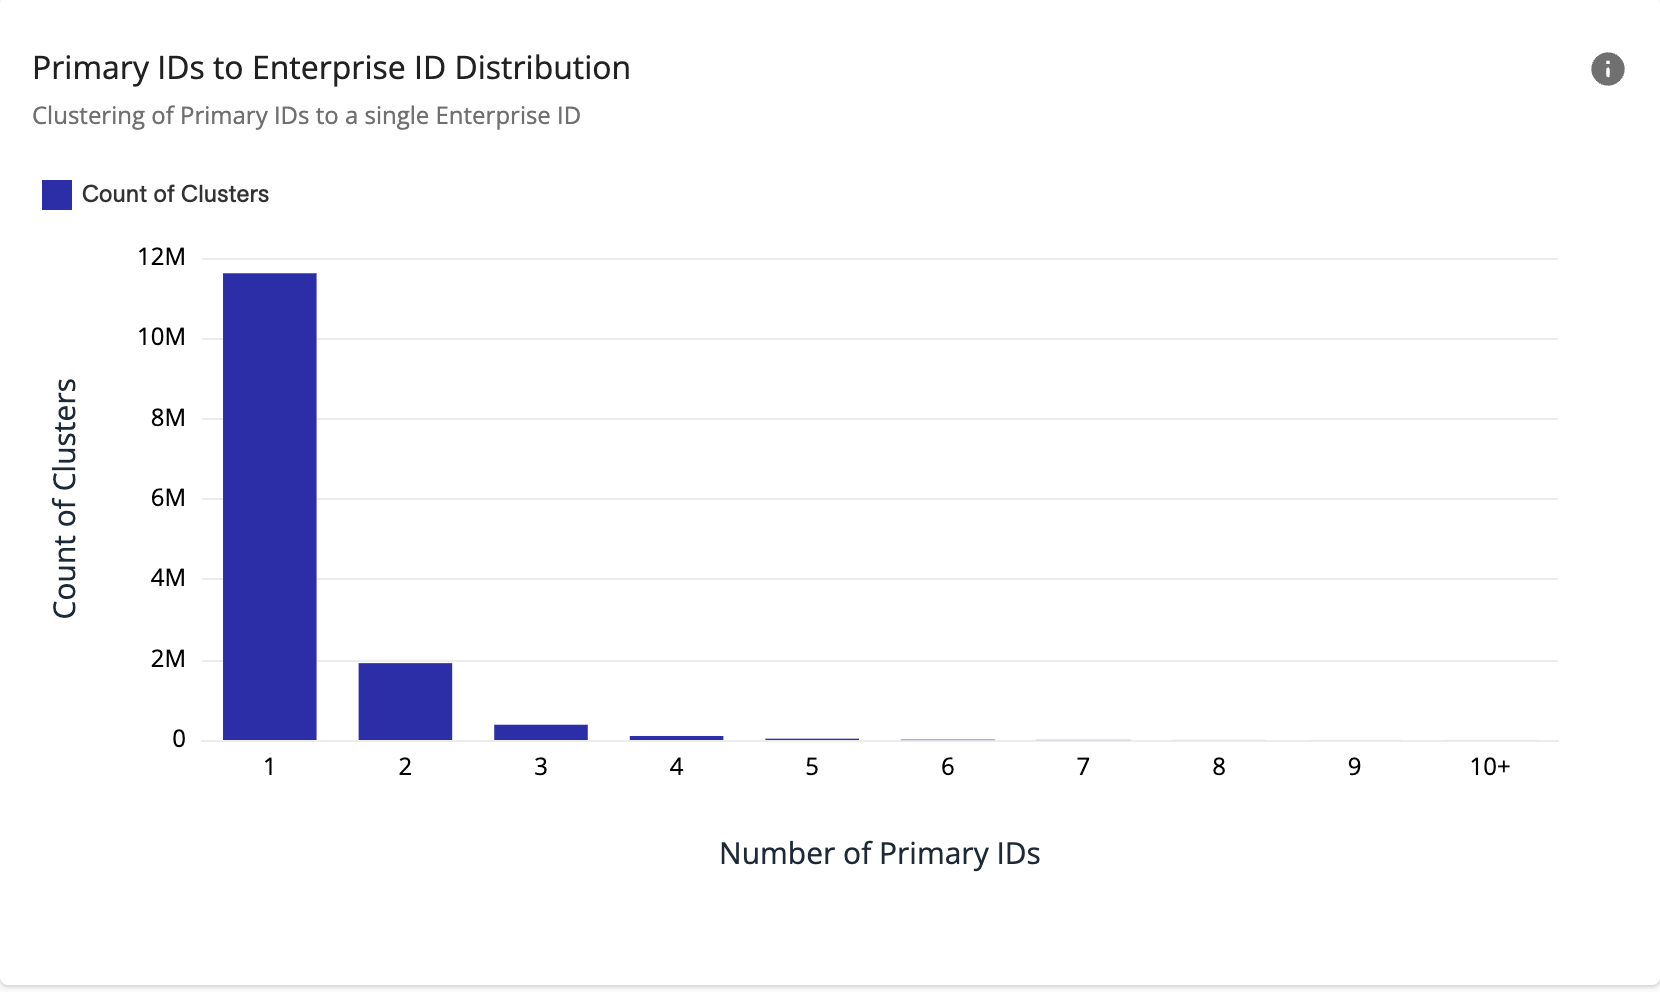
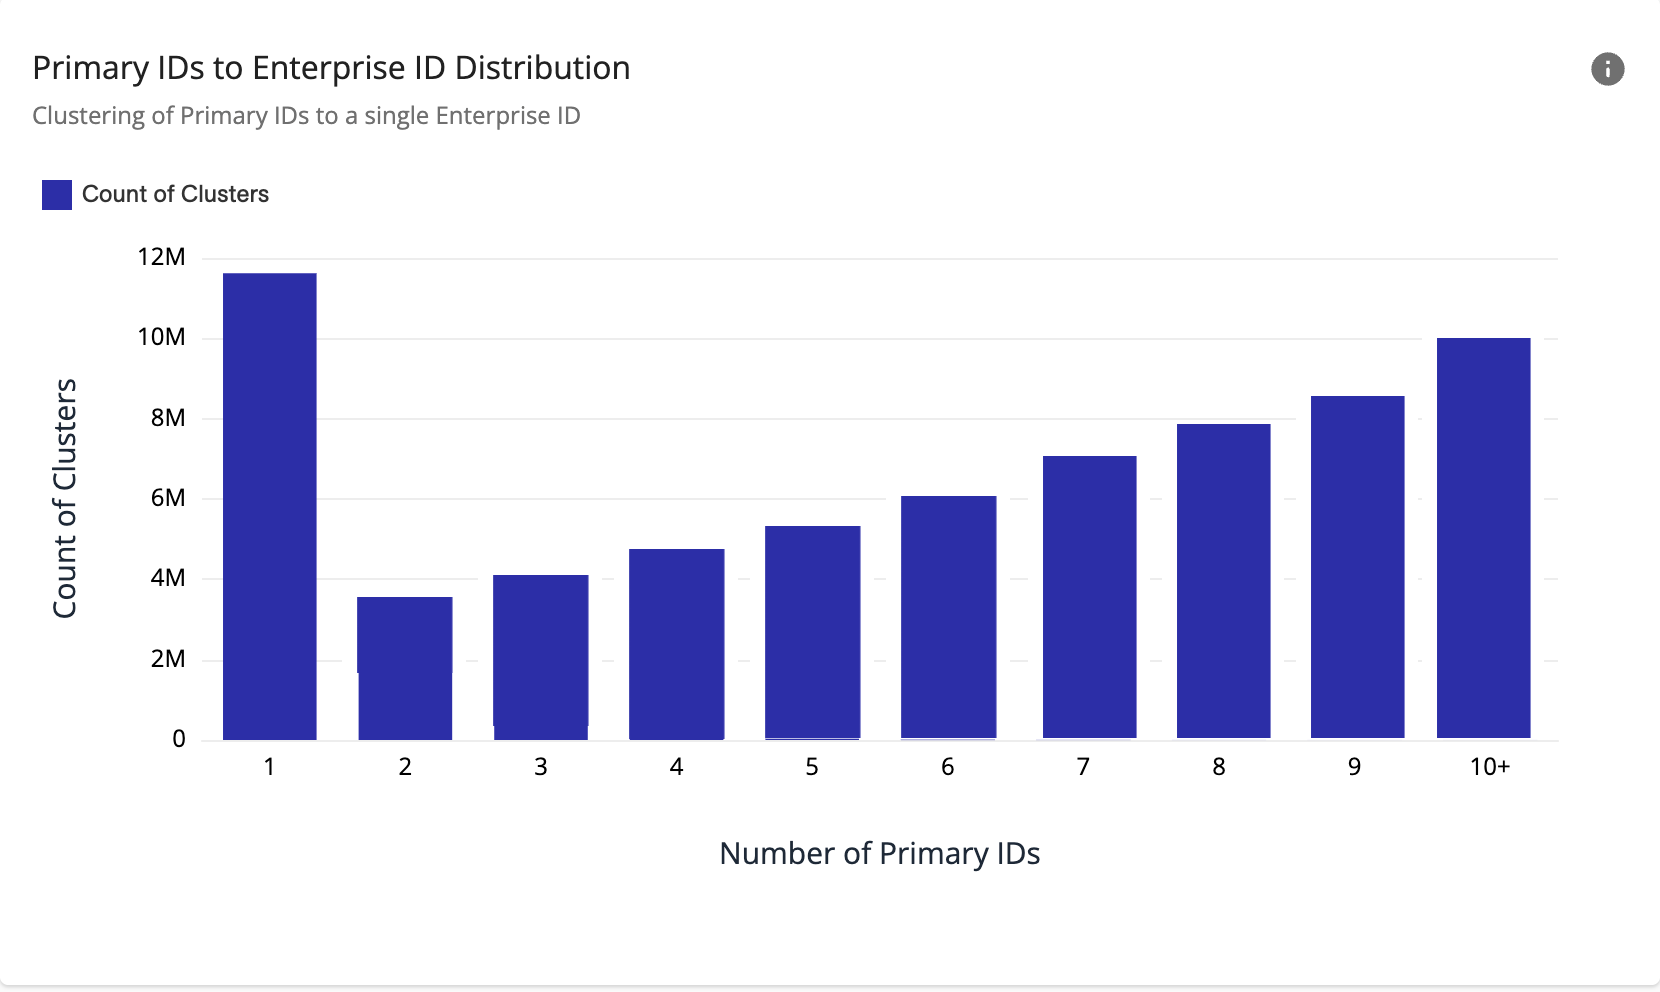
Primary IDs to Enterprise ID Distribution
The “Primary IDs to Enterprise ID Distribution” chart displays the total number of clusters associated with a single Enterprise ID by the number of Primary IDs the clusters have. A "cluster" is a group of records from source data representing a person, and an Enterprise ID is then associated with this cluster. Generally, the number of clusters with more than one Primary ID should decrease from left to right on the chart (see below), if your resolution rules are working well.
Note
Hover over the source data within the chart to display more details. To show or hide sources, click the corresponding source icons located at the top of the chart.
If a Primary ID is not configured in the Data Preparation processes, a system generated Primary ID will be used.
Note
The “10+” category represents clusters with ten or more Primary IDs. Because this is an aggregated category, an increase in the number of clusters in “10+” when compared to the other categories should be interpreted differently.
If you find that the total number of clusters with more Primary IDs is increasing as you move right (see below), this could indicate that there might be something wrong with your data sources or that your resolution rules need to be adjusted.
Consolidation Rate
The “Consolidation Rate” chart shows the consolidation rate of identifiers from Input Records, to Customer IDs, to Enterprise IDs. This can be useful to see how well your data preparation and resolution processes are working to develop and maintain your identity graph. The “Consolidation Rate” chart compares the following values (when available):
Input Records: The total number of unique rows in the input data.
Customer IDs: The number of unique IDs mapped as a Customer ID in the Data Preparation processes of the workflow.
Enterprise IDs: The number of unique IDs mapped as an Enterprise ID, the customer-specific identifier of a group of records that belong to the same person.
Typically, the number of Customer IDs should be less than the number of Input Records, and the number of Enterprise IDs should be less than the number of Customer IDs (see below).
Note
Hover over the source data within the chart to display more details. To show or hide sources, click the corresponding source icons located at the top of the chart.
If a Customer ID is not configured in the Data Preparation processes, it will not display in this chart.
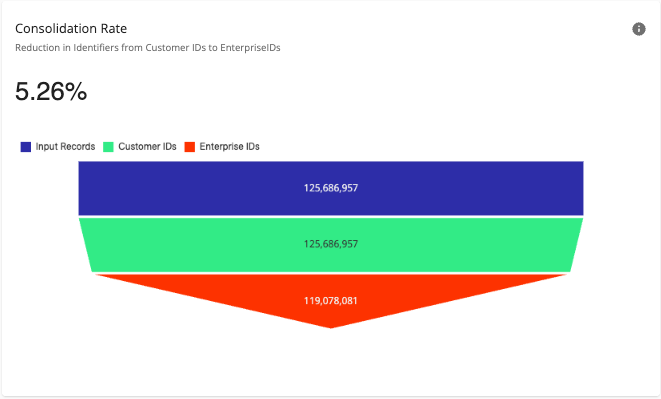
The consolidation rate percentage indicates the percentage change (positive for a percentage increase, negative for a percentage decrease) in the number of Customer IDs compared to Enterprise IDs for this workflow run.
A relatively small positive consolidation rate can mean that you need to evaluate your resolution rules. For example, you might have instances of duplicate data for the same person that your resolution rules are not consolidating. However, it could also mean that the data source you are using is already fairly consolidated.
A negative consolidation rate, where the number of Enterprise IDs is greater than the number of Customer IDs, can indicate that you need to evaluate your resolution rules. It can also mean that your data source already contains significant overconsolidation that is being corrected in the workflow.
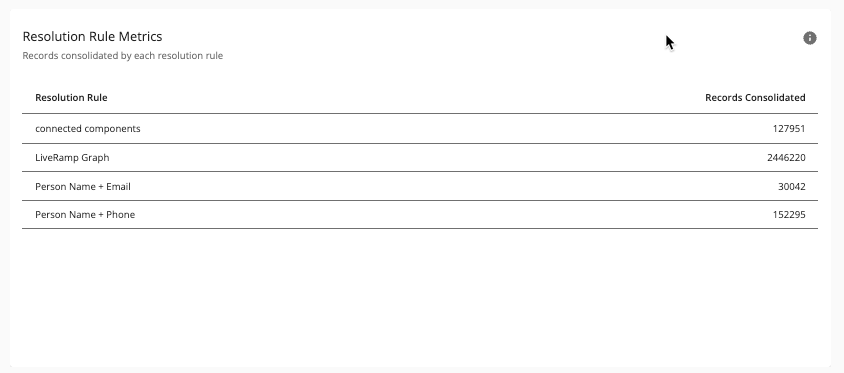
Resolution Rule Metrics
The “Resolution Rule Metrics” table indicates the number of records that each resolution rule consolidates into Enterprise IDs. This can be useful to indicate the effectiveness of your resolution rules. Rules with extremely high or low numbers of records being consolidated might indicate data consolidation issues. This could mean that some of the data or the data rules you’re using need to be further analyzed to ensure they produce the intended results.
Note
The total number of records consolidated will likely be higher than the total input records, since the same input records can be consolidated by multiple consolidation rules. For example, consider two records for the same person: one with customer ID 123 and another with customer ID 456. Both records have the person's name, email, and phone number. These will be consolidated by both a "Name + Email" rule and a "Name + Phone" rule. Thus, two input records result in a total of four consolidated records (two for each rule).
The “Records Consolidated” metrics will also include “connected components”, which are records that merge as a result of “transitive merging”. For example, if Record A merges with Record B due to Rule 1, and Record B merges with Record C due to Rule 2, Record A and Record C will have indirectly merged via these “connected components”. “Connected components” are not a rule you configure directly, but are indirectly applied and calculated by Identity Engine.
A rule that has a large percentage of records consolidated might indicate over-consolidation. This could be caused by a rule with conditions that are not specific enough or data that might not be unique enough. For example, a “Name + ZIP Code” rule could result in over consolidation. Or, a “Phone” rule that processes data that contains placeholder values that are not nulled, e.g., “111-111-1111”, could also result in over consolidation.
Total Accepted and Rejected Records
The “Total Accepted and Rejected Records” chart displays the number of valid emails, invalid emails, and suspected fake emails in your source data for this workflow run. This can be helpful to let you know the quality of your data sources so you can improve match rates. Records are rejected if they don’t contain matchable data, so this is an important metric to help guide you in your data preparation.
Note
Hover over the source data within the chart to display more details. To show or hide sources, click the corresponding source icons located at the top of the chart.
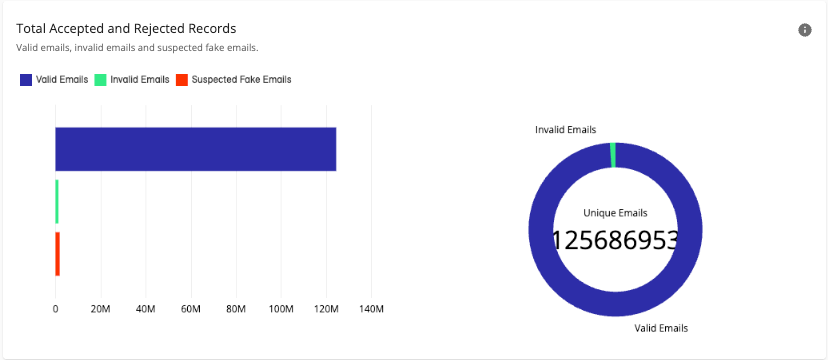
A large number of invalid or suspected fake emails could indicate the use of placeholder values (e.g., “noreply@email.com”) or problems in the quality of the data source.
Data Field Metrics
The "Data Field Metrics" table shows information about mapped and generated data fields used in your workflow.
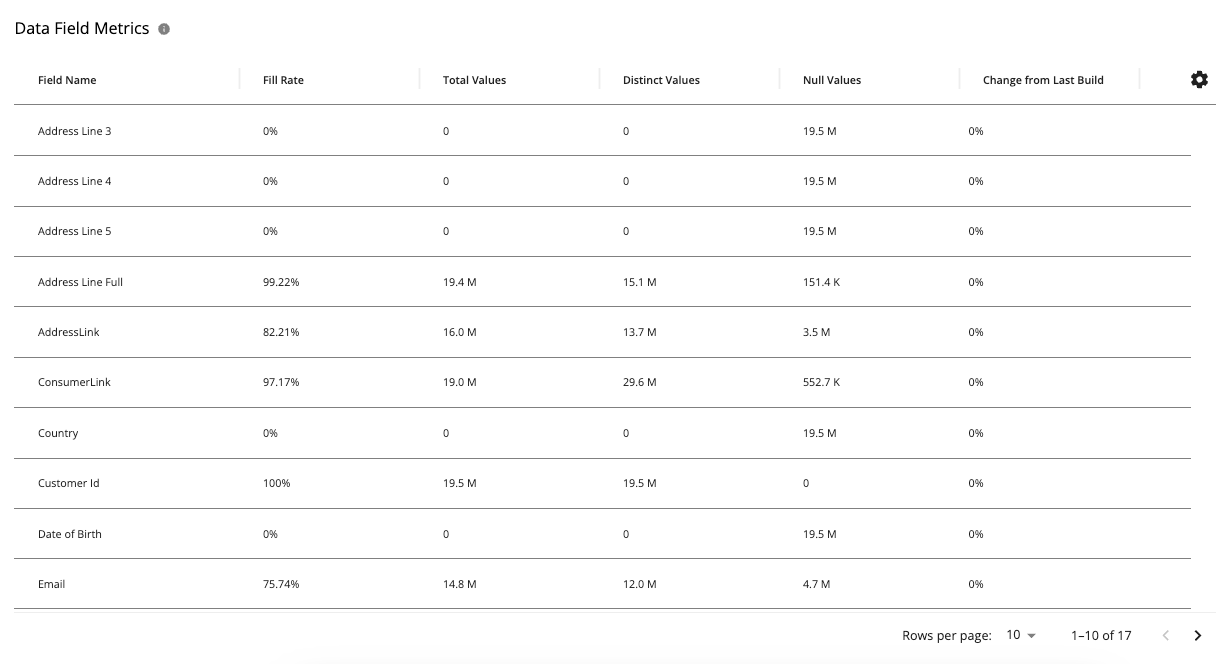
The table includes the following information:
Field Name: The name of the data field.
Fill Rate: The percentage of how many records contain values for this data field. A low fill rate can indicate that the data field you’re using is not very useful for populating your identity graph.
Total Values: The total number of values for this data field.
Distinct Values: The number of distinct values for this data field. This can be useful to indicate issues with your data or process rules. For example, if the number of distinct values is low, this field might not be very useful because it can cause overconsolidation. If the number of distinct values is high, this can cause a failure to consolidate records. Depending on the kind of data, this can also help verify that the data is correct. As an example, if a field should only have a certain number of values (e.g., number of states in the U.S.) and the value exceeds what’s expected, then you would want to investigate your data and process rules.
Null Values: The number of null values for this data field. This can be useful to indicate gaps in your input data or identify data fields that are empty and not contributing to an increase in match rates.
Change from Last Build: Percentage change in the number of values for this data field from the previously run workflow. This can be useful to indicate issues with your data source or process rules. If the percentage in the number of values for this data field unexpectedly increases or decreases significantly, it might mean that something has changed in your data source or process rules and this field is not getting populated as might be expected. This could happen, for example, if you changed your data source file format without remapping it in your data preparation processes.
Export Graph Build Overview Dashboard Metrics
You can export the Graph Build Overview Dashboard metrics you are viewing so they can be shared with stakeholders or included in reports.
Note
Exports reflect the workflow run currently selected when you start the export.
In the dashboard toolbar, select the Export as drop-down:
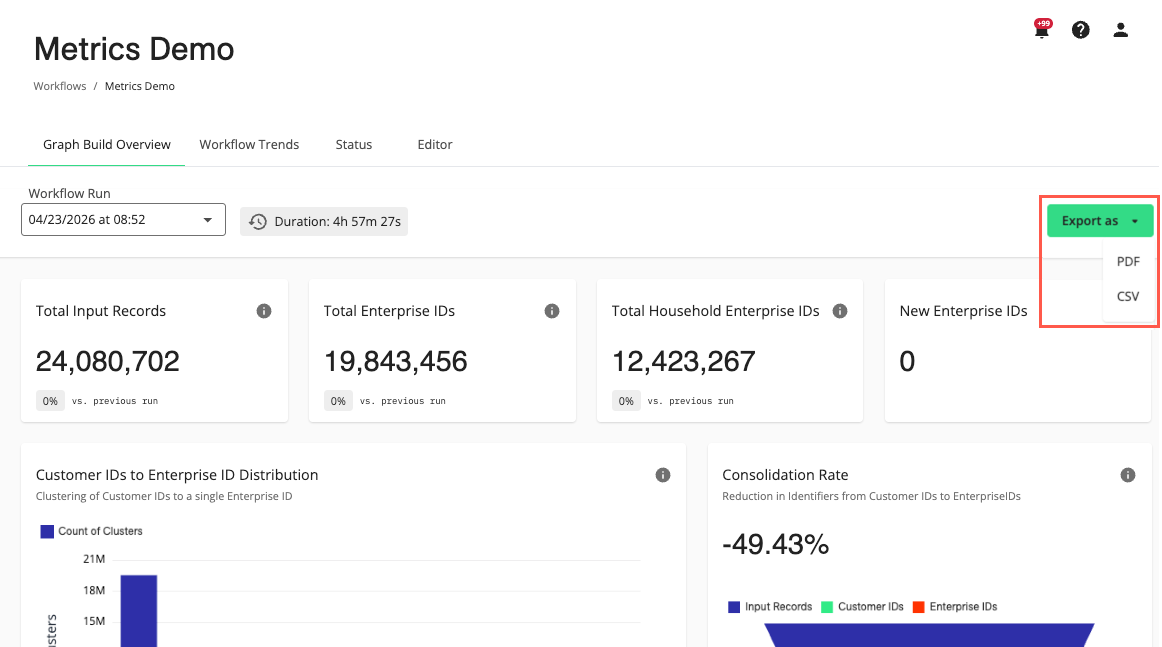
Choose one of the following export options from the drop-down list:
PDF: Downloads a snapshot with all visible charts, tables, and summary tiles in a PDF file
CSV: Downloads the underlying data as tables with headers, labels, and values in a CSV file