SQL Editor
SQL Editor is the main LiveRamp Data Collaboration Platform page where you can:
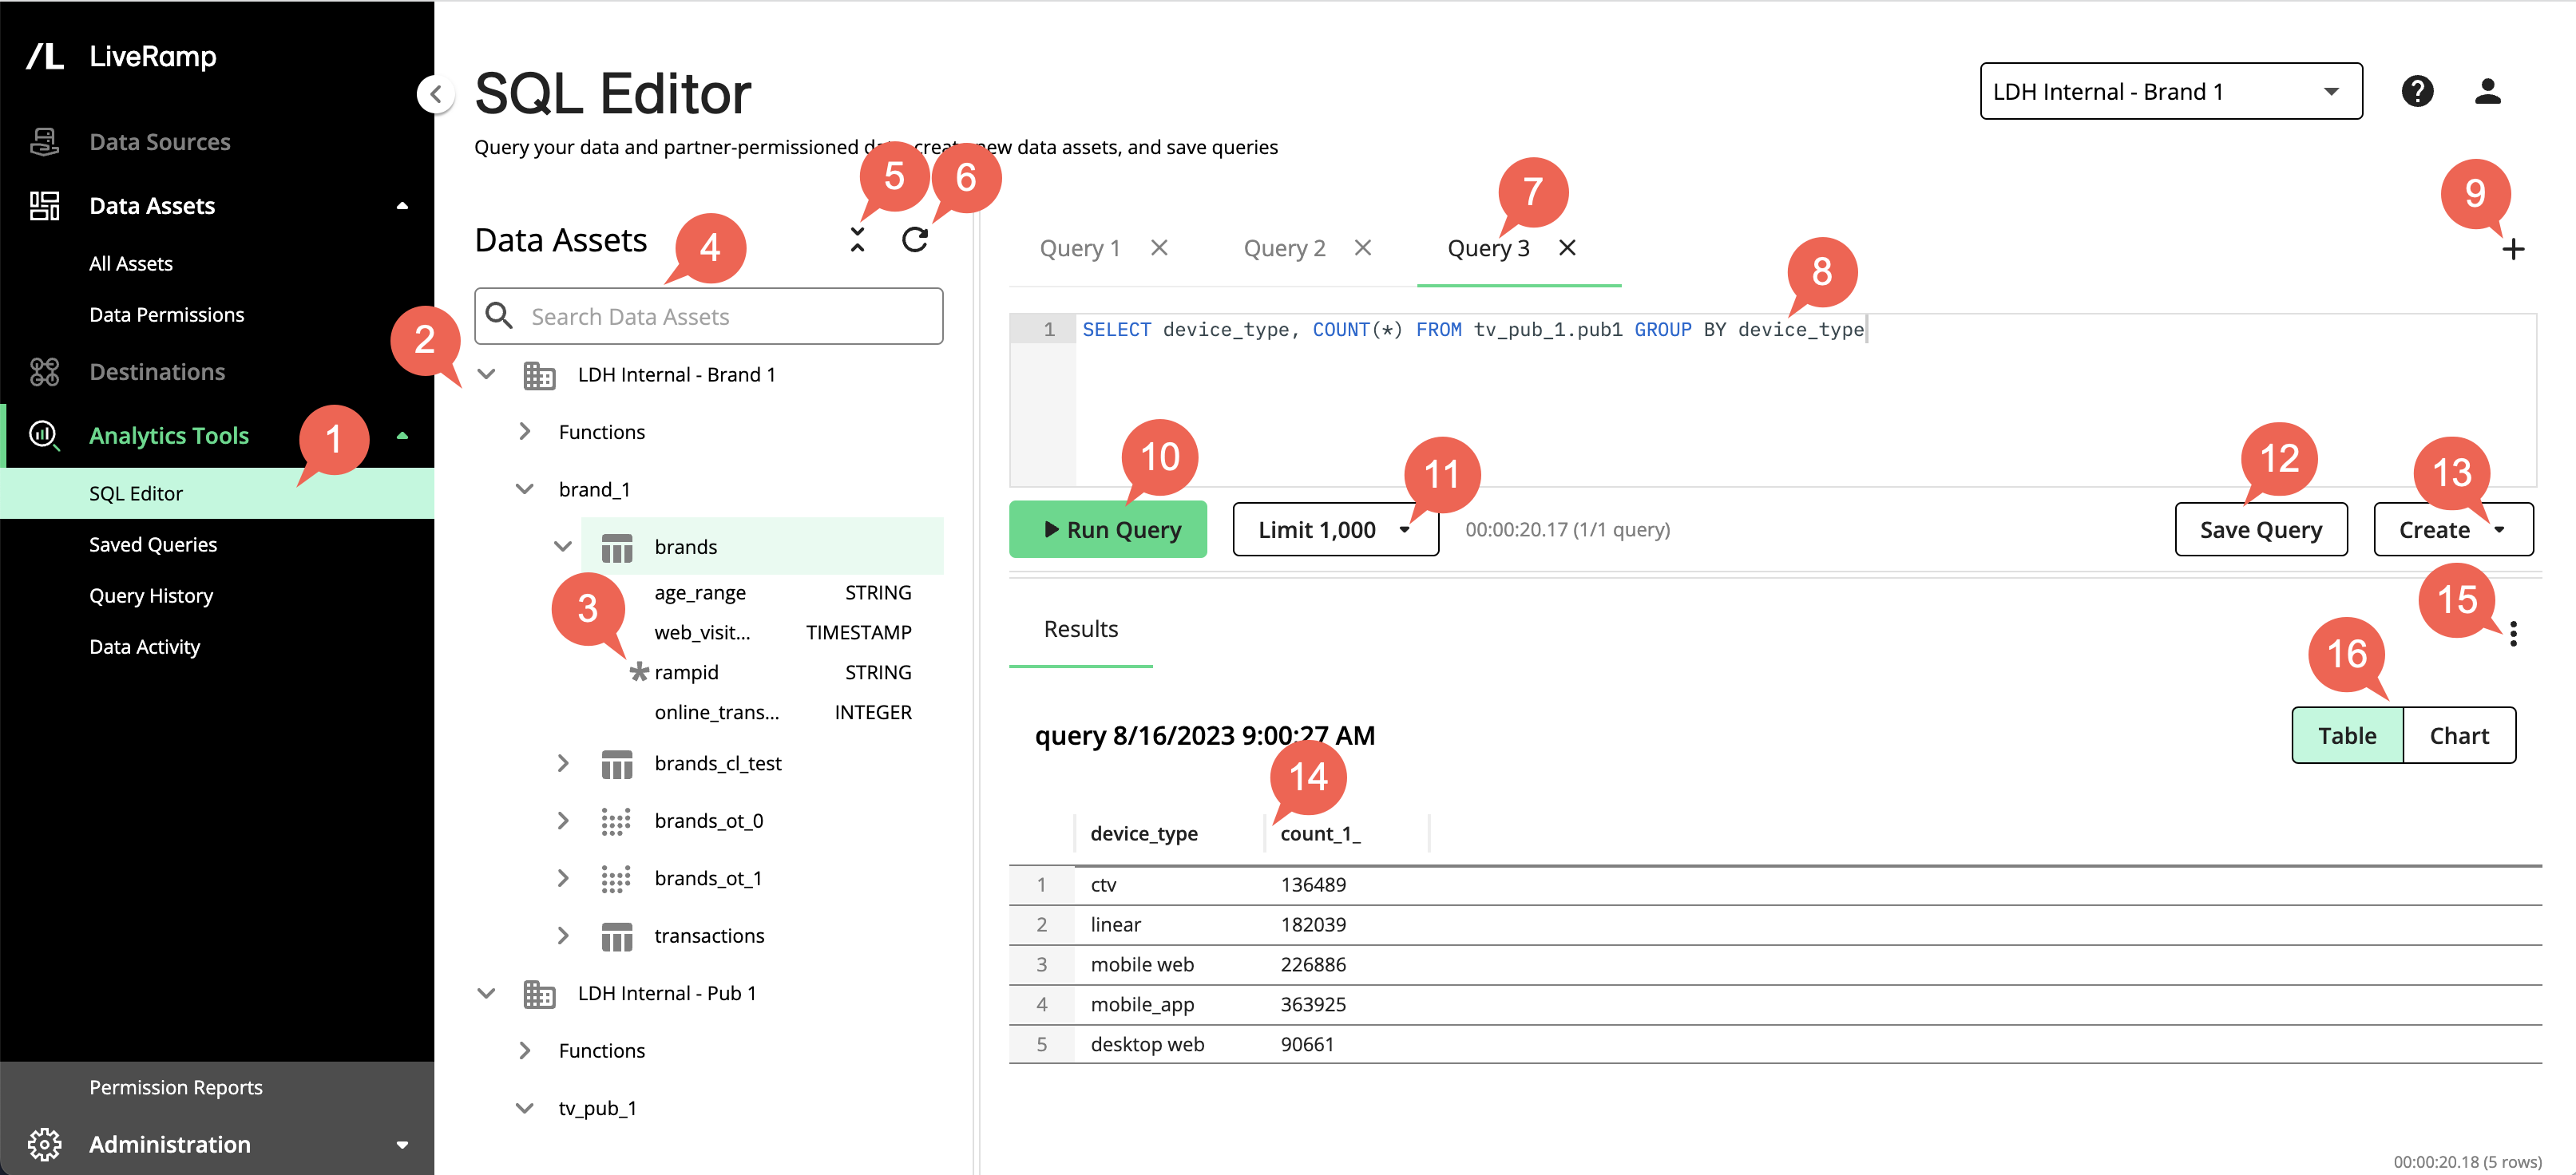
From the navigation pane, select → to open SQL Editor.
The All Assets pane allows you to explore data assets and their columns: your organization's first-party data and any assets that your partners have granted access to are displayed under the organization icon (
 ) and the organization's name. "UDFs" refers to user-defined functions, which you can use to share the results of your analyses with your partners rather than sharing record-level data. "Views" and "Segments" refer to the views and segments that your organization has created.
Note
When querying assets, you should typically prefix the asset name with the name of its parent node and a dot if the asset is not within the "UDFs", "Views", or "Segments" nodes (for example, "pub_1.campaign1_view" where pub_1 is the parent node and campaign1_view is the asset name).
An asterisk icon
 indicates a sensitive column (such as a household ID or a RampID) that is never displayed to any users. Most SQL functions cannot be run on sensitive columns, although counts and joins are allowed.
 You can search across data assets that are available to you, such as by name or by column. If you need more information about the available data, click All Assets in the left-hand pane and click the corresponding row on the All Assets page.
You can quickly expand and collapse your data asset tree to help explore your assets.
You can refresh the view of the Data Assets list to see any newly granted data assets.
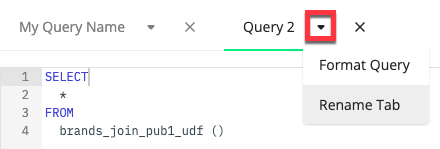
You can keep multiple query tabs open during a session and have options to rename the tab and to format your query.
SQL Editor supports a set of common SQL functions. Most SQL functions cannot be run on sensitive columns (such as RampIDs), but counts and joins are allowed. To be able to join a dataset, the data owner must grant Join permissions to your organization.
Click to add a query tab. You can keep multiple queries open but only one Results area.
When you're done writing a query, click to run it. You can click Cancel if needed.
You can limit the query results that are displayed on the page to 10, 100, or 1000 rows. To limit the actual query results, use the
limitclause in your query to constrain the number of rows returned by theselectstatement.Note
The maximum data output from queries is 10 MB per user per day.
You can save a query, give it a name, and retrieve it at any time on the Saved Queries page. If you rename the query's tab and click , the tab's name will populate the Query Name box and be used on the Saved Queries page.
Click to create a view from the current query.
If your query results have multiple columns, you can sort by column and adjust column widths.
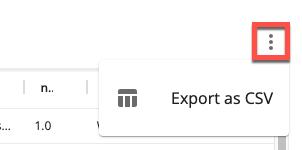
You can export your query results as a CSV file.
Your results are displayed as a table by default. If your results support a chart display, you can select the chart option to generate a chart.