Edit a Profile
When LiveRamp creates your account, we create a profile that contains our default Insights visualizations. You can edit this profile to add or remove visualization elements such as bar charts or pie charts.
You can also create a new profile and then edit it to customize the visualization elements you want to appear.
Note
For information on the types of Insights visualizations that you can create, see "View Audience Insights."
In the left navigation bar, click Safe Haven and then click Profiling.
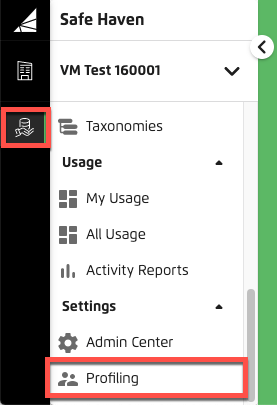
The Profiling page appears.
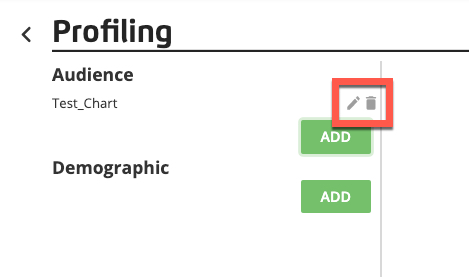
Click the edit icon in the row for the profile you want to edit.
Click the appropriate button for the type of visualization you want to add:
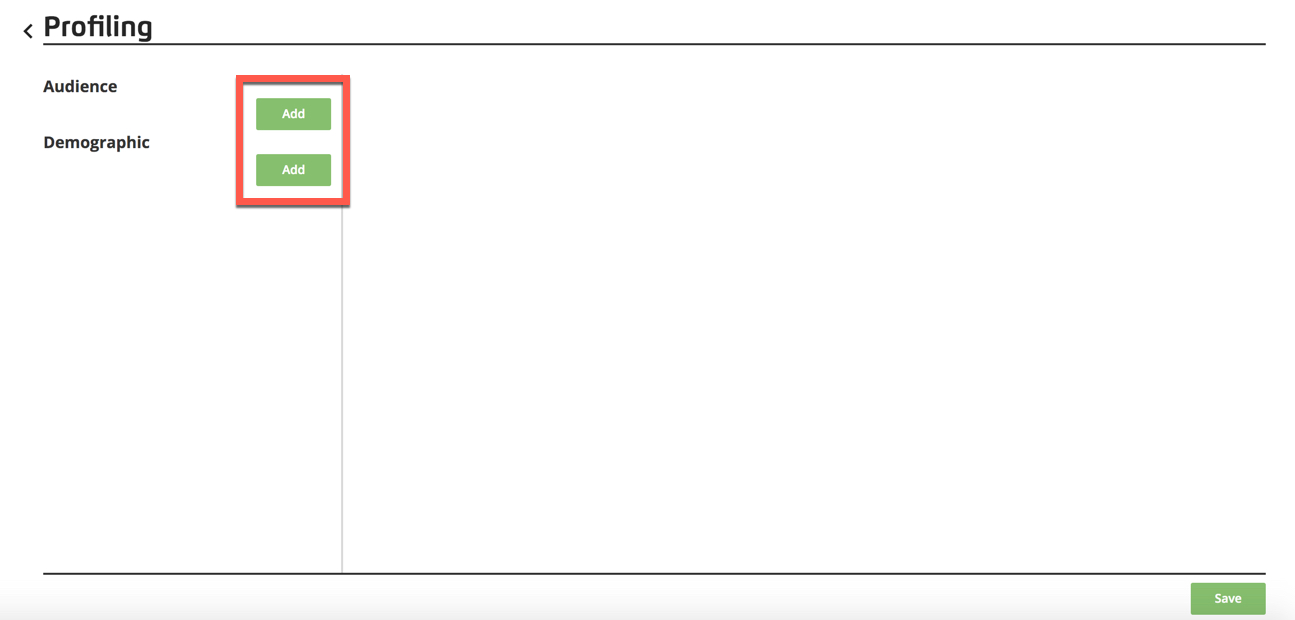
Audience visualizations compare the selected segment values in the built audience to those values in other specific audience data in your account (the "base" audience). This can be either data you own or partner data that has been permissioned to you with the "Build Insights for audiences built using this data" use case.
Demographic visualizations compare the selected segment values (that you choose in a later step) in the built audience to those values in your entire Safe Haven account identity space. So for demographic insights, the "base" audience is your account identity space.
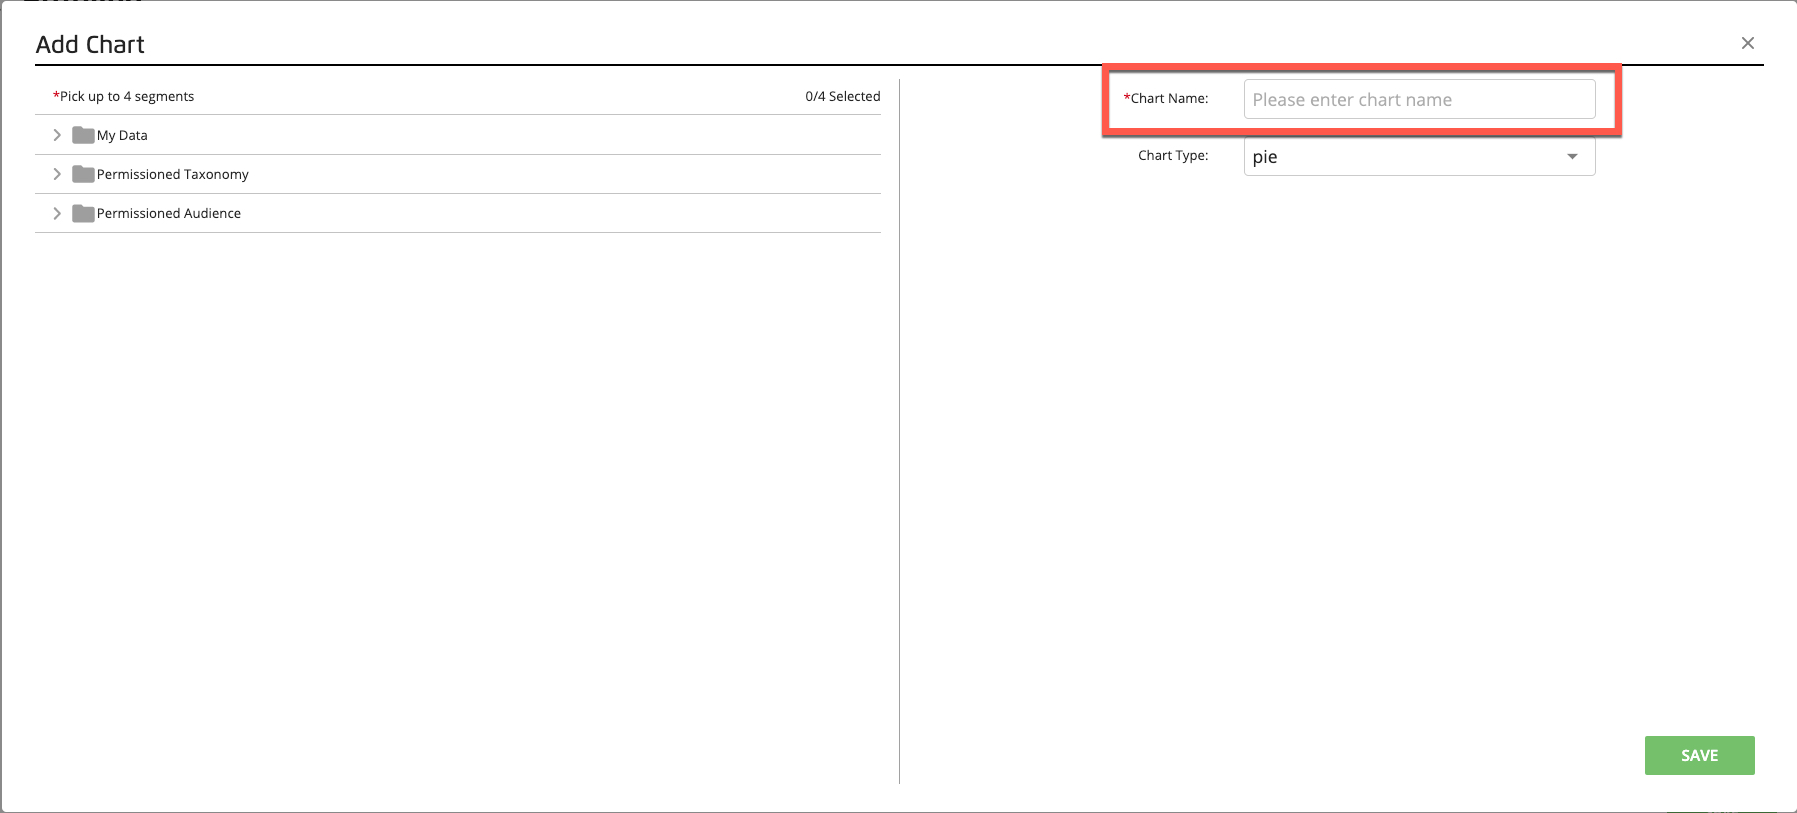
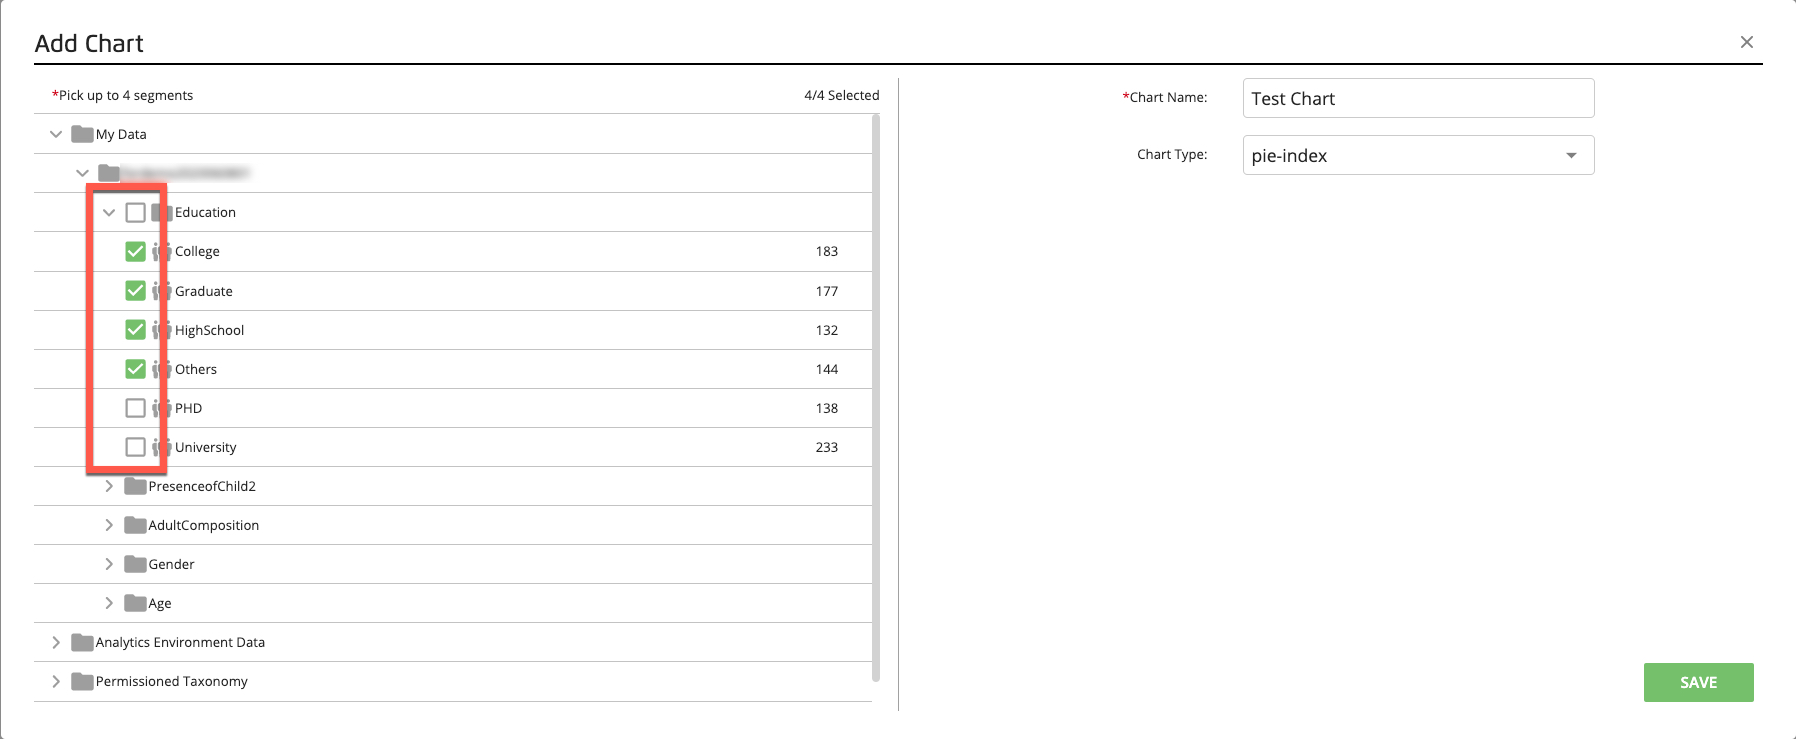
Enter a chart name.
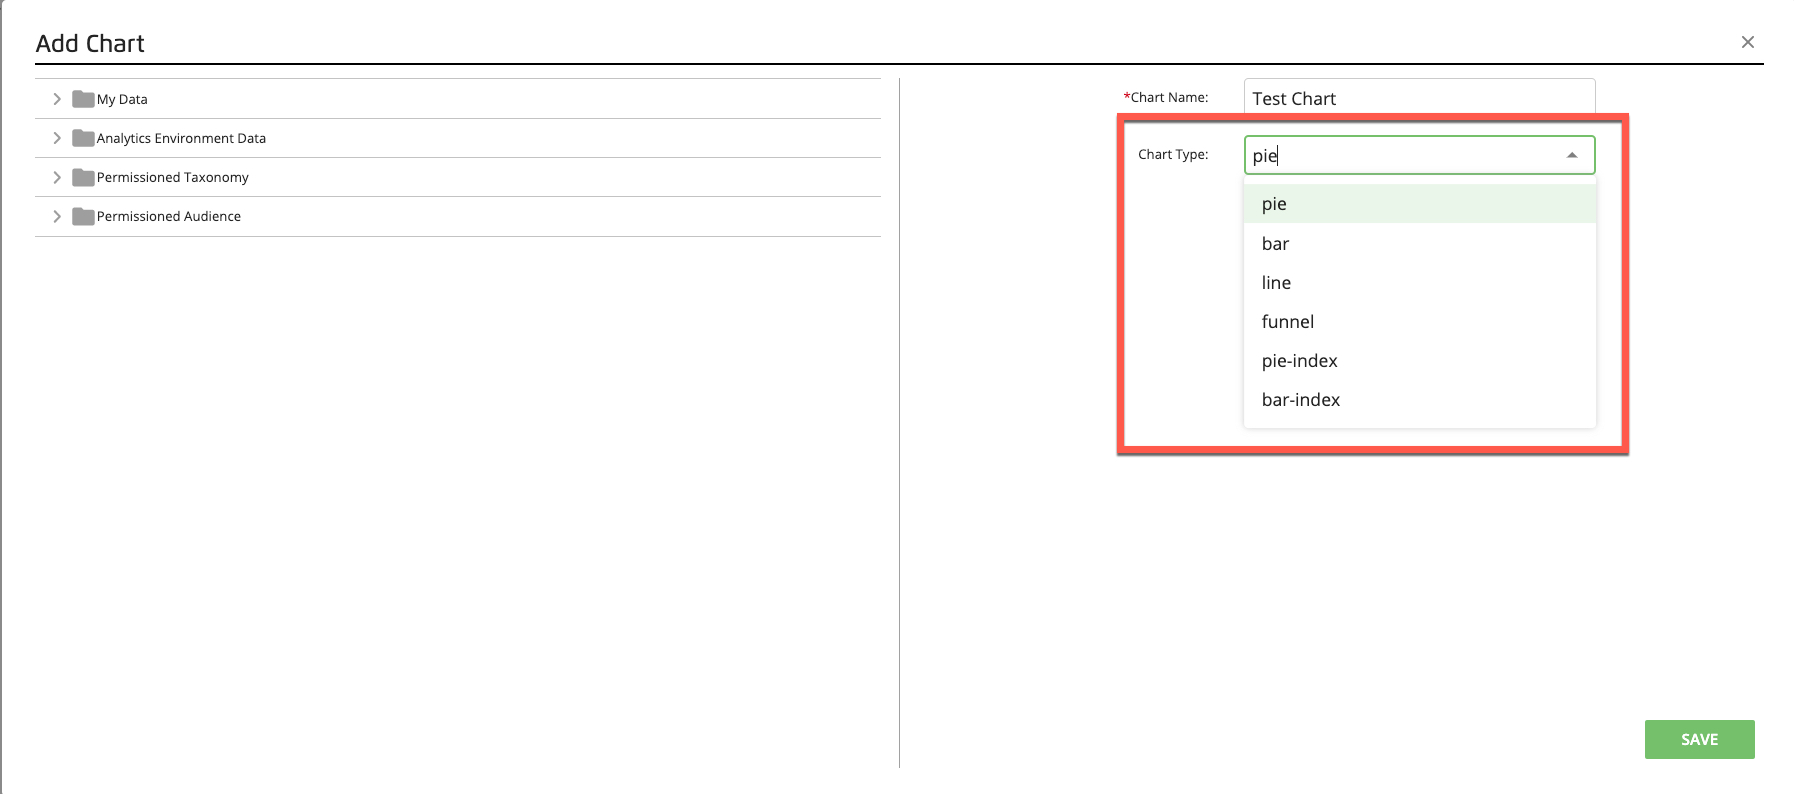
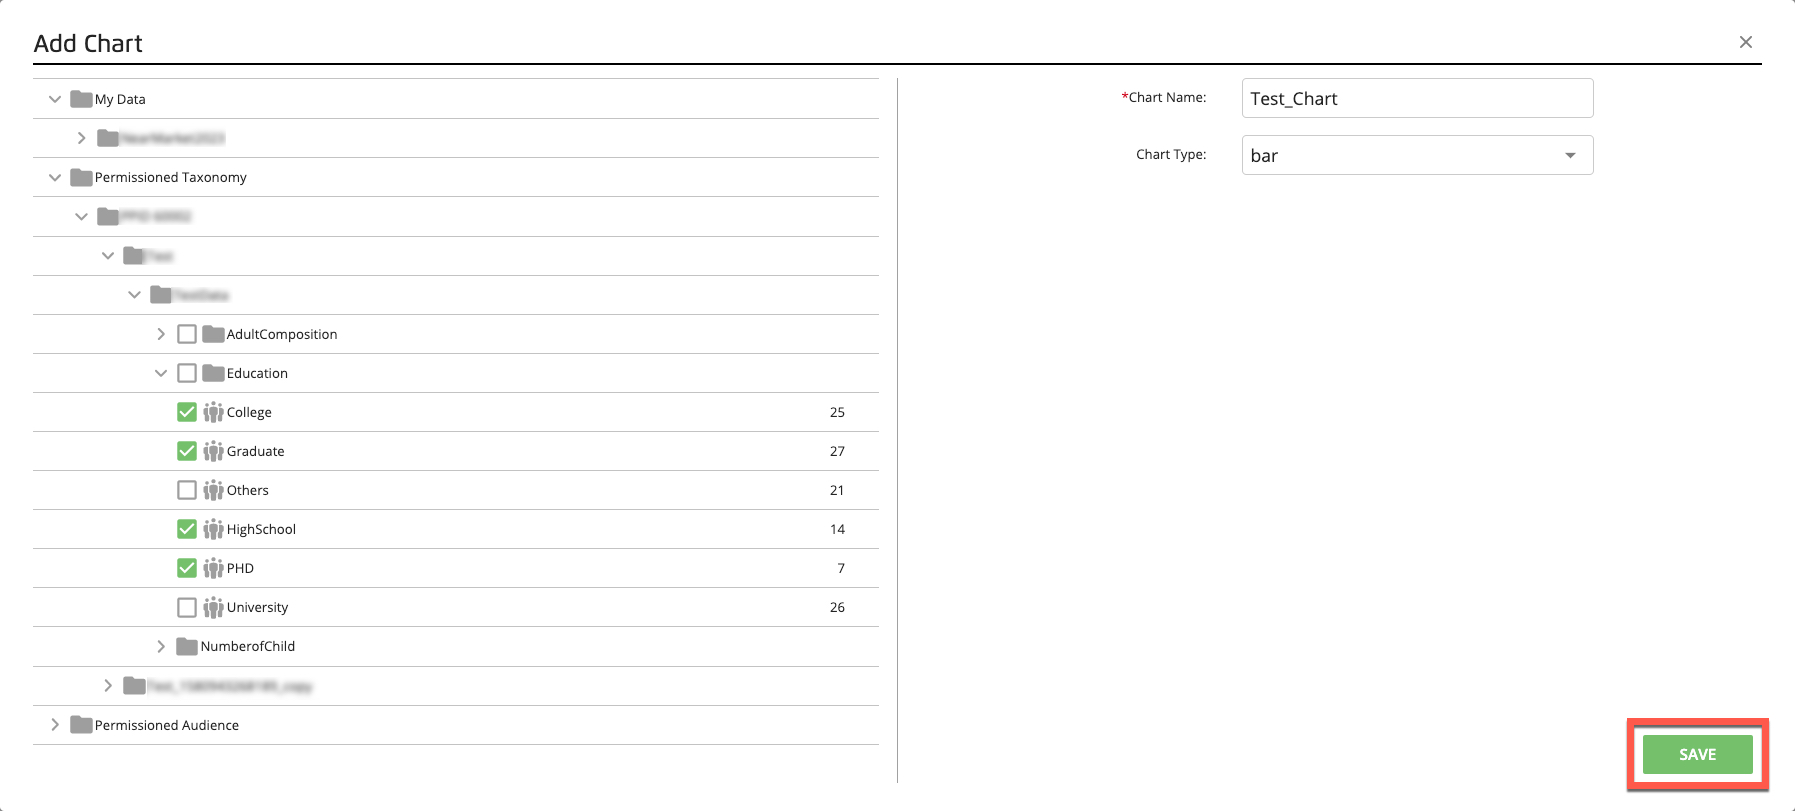
Select the chart type from the chart type dropdown list.
Note
Some of the chart types are not available for the Demographic visualization type.
Pie
Bar
Line (only available for the Audience visualization type)
Funnel (only available for the Audience visualization type)
Pie-index (only available for the Audience visualization type)
Bar-index (only available for the Audience visualization type)
Select the desired segment attributes to display in the chart by opening the appropriate folder and subfolders, and then checking the appropriate check boxes.
Note
If a partner has permissioned data to you with “Build Insights visualizations using this data” permission, you can use the segments in that data to build a visualization in your profiles.
Note
You do not have access to audiences that have been built in your account (the audiences that are stored in the "Saved Audiences" folder in the Audience Builder).
Tip
For pie charts, you are limited to a maximum of four segment values per visualization.
For other chart types, there is no limit on the number of segment values per visualization, but selecting more than three to five values might make the chart less useful.
Click .
Repeat this process until you’ve added all desired visualizations.
Note
To edit or delete a visualization, use the icons that appear next to the chart name.
Click .
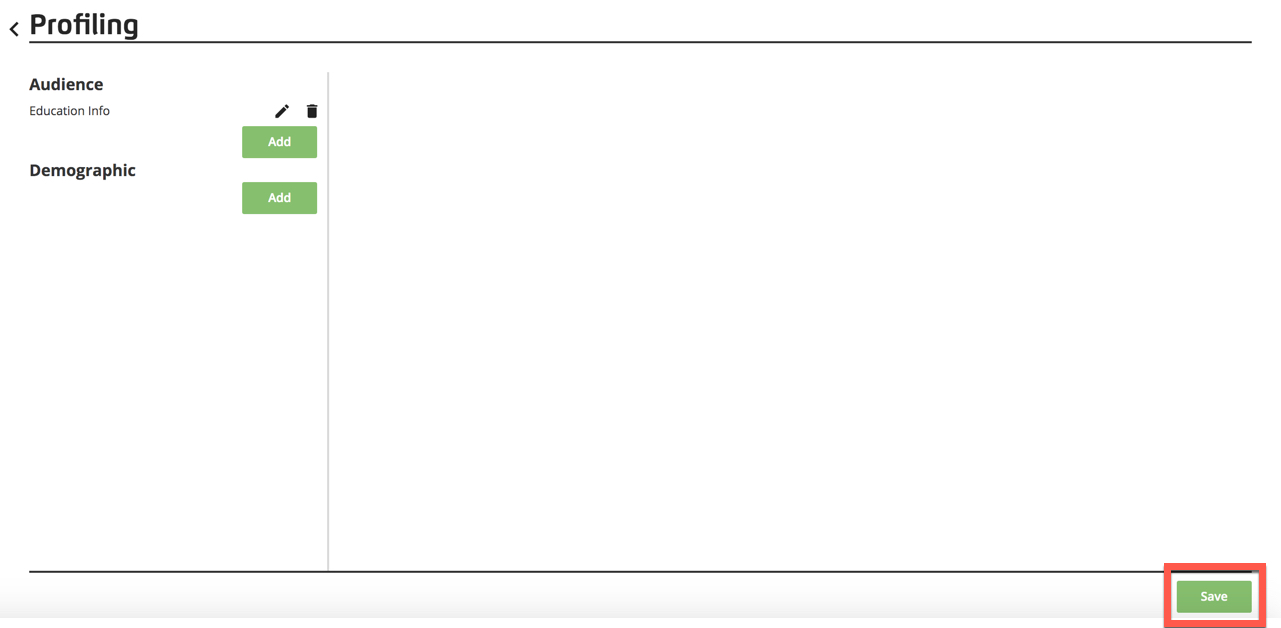
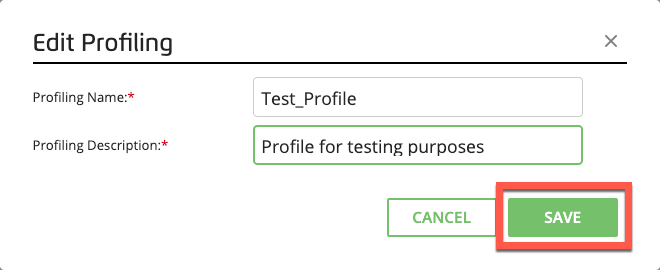
From the Edit Profiling dialog, confirm or edit the name and description, and then click .
If you want to make this profile the active profile, see the instructions in "Making a Profile the Active Profile."