Working with Spark Jobs Submit
Spark jobs submit allows the user to submit code to the Spark cluster that runs in a non-interactive way (it runs from beginning to end without human interaction). This approach uses the PySpark engine for processing.
This method can be used for long-duration jobs that need to be distributed and can take a long execution time (such as jobs that manipulate a very large amount of data or that perform complex transformations). The job is run in a non-interactive way, meaning the process runs the entire set of code all at once and you wait for the process to complete before seeing the results.
Tip
You can also use the Job Management page or the Job Management API to schedule a PySpark job. For information, see "Create a Scheduled Job" and the Job Management API Documentation.
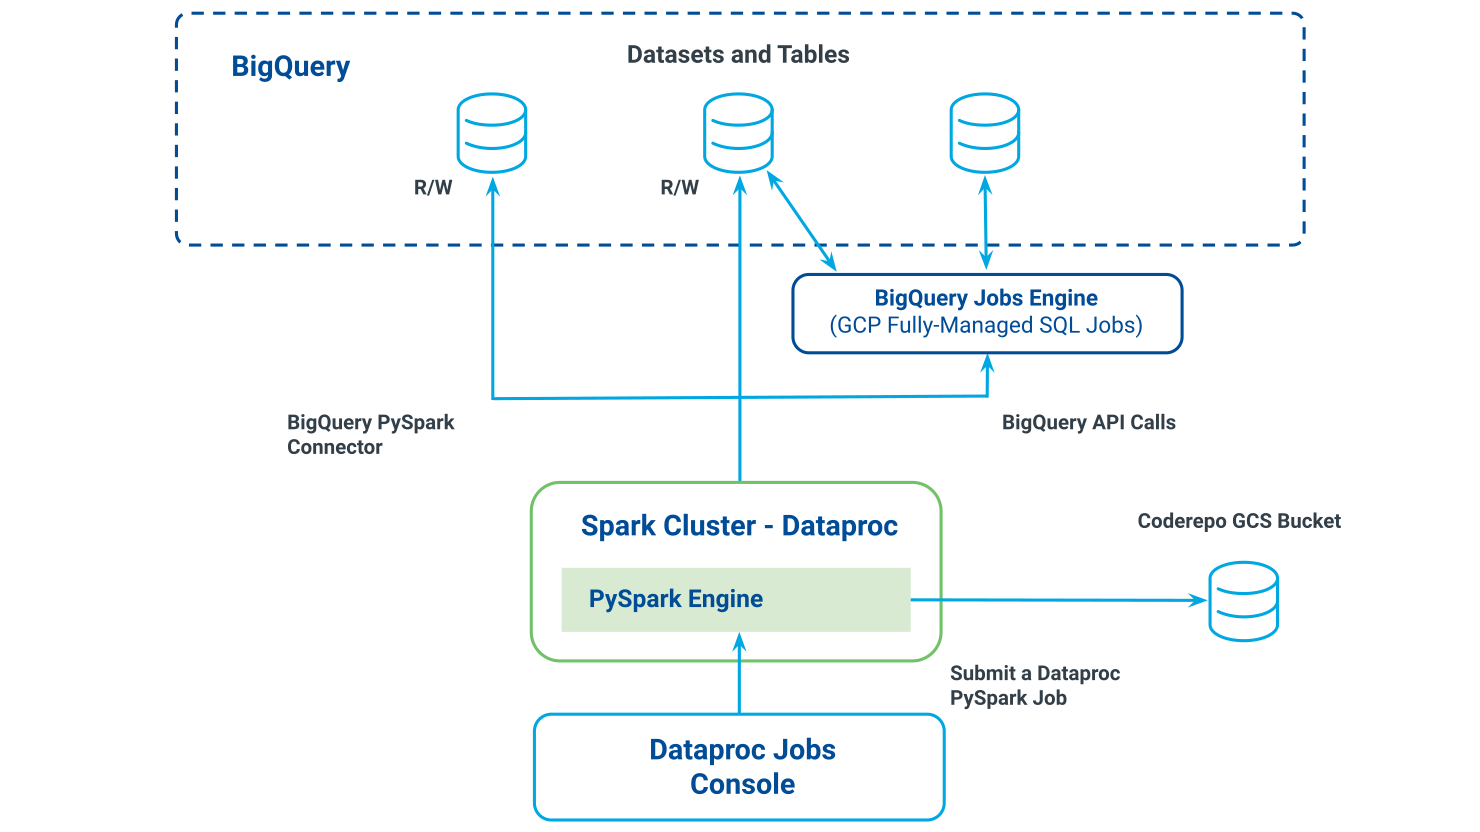
Relationship between Dataproc console, Spark cluster, and BigQuery:
There are several methods you can use to submit a job in the cluster. For all methods, follow these guidelines:
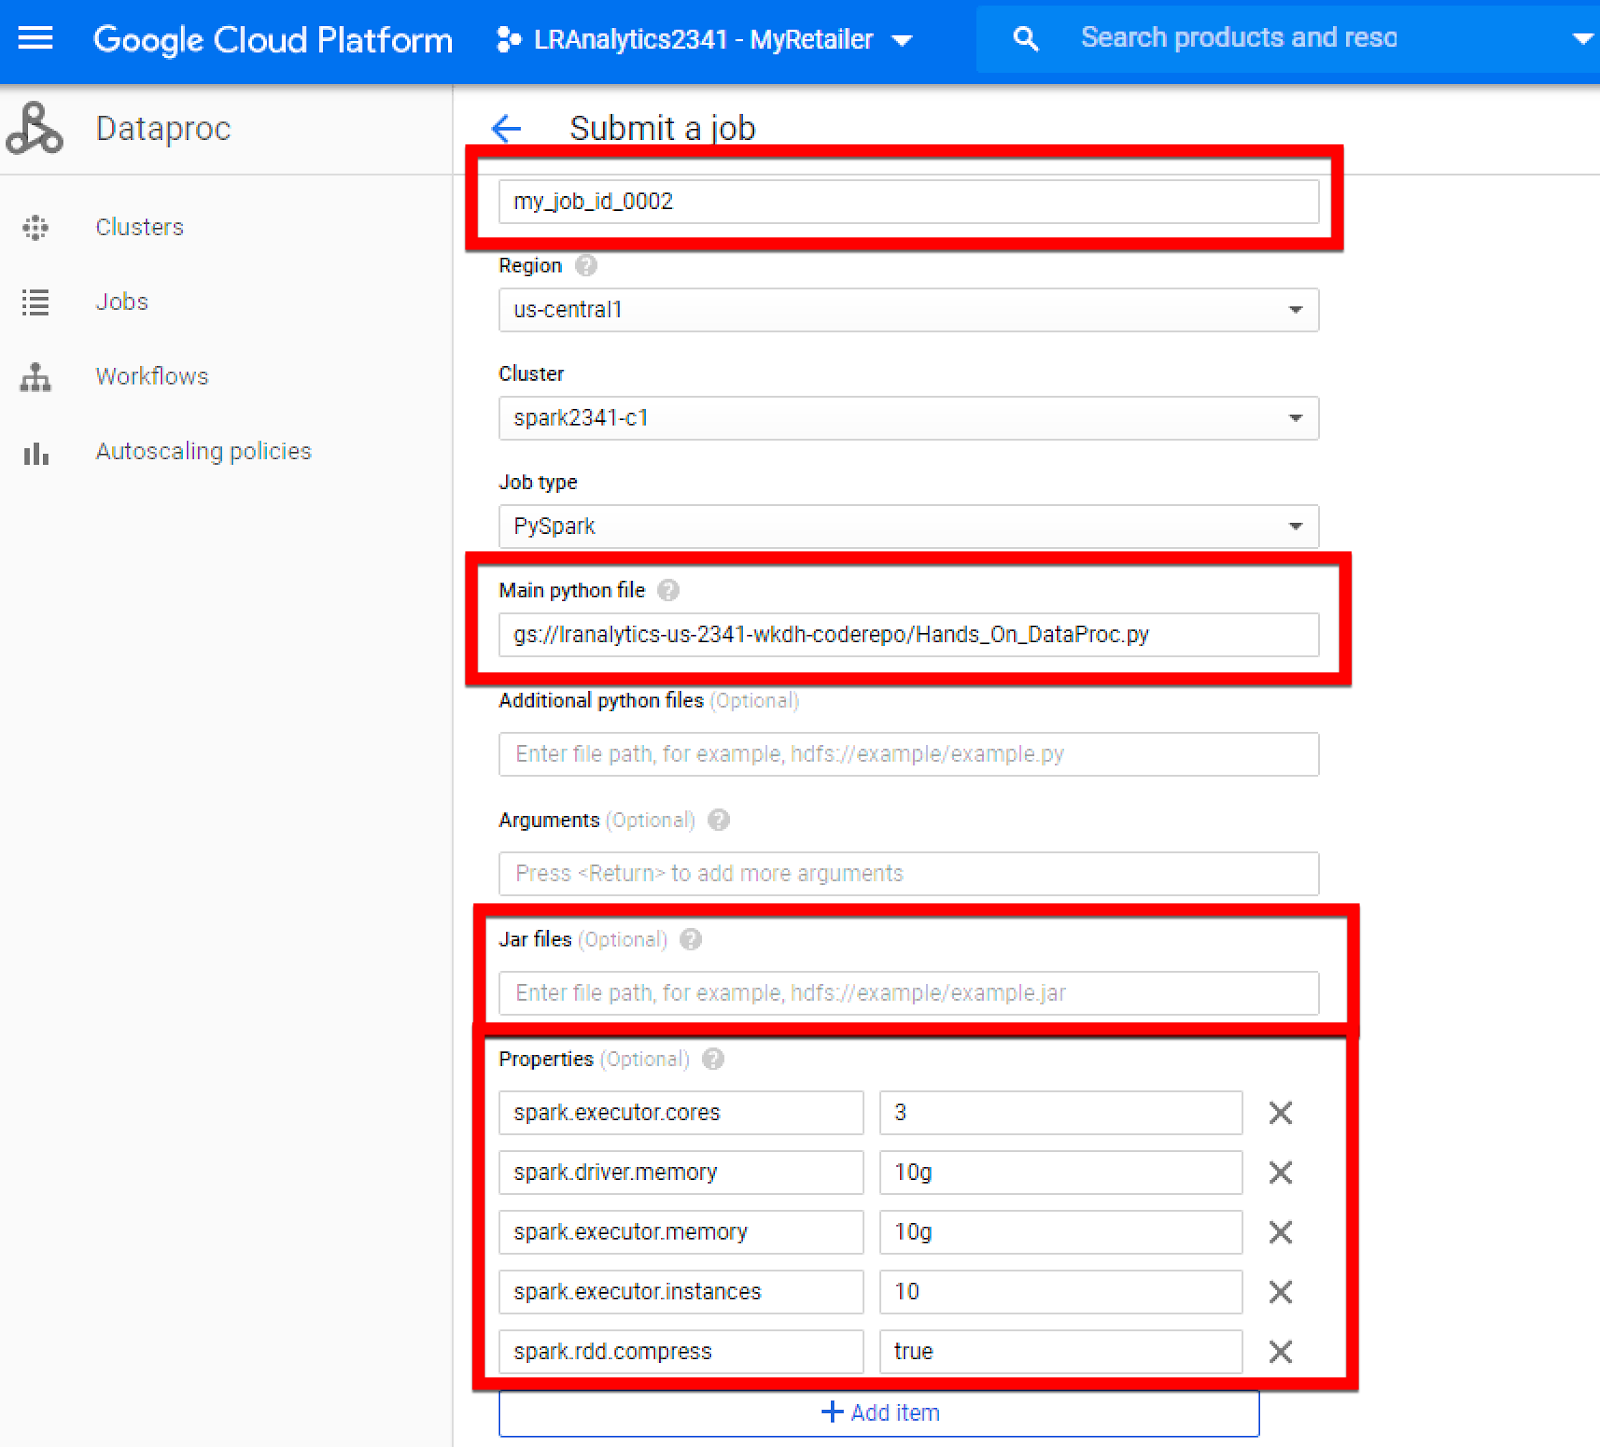
Job ID has to be unique.
Tip
The region is preselected as default so no need to change.
Specify an absolute GCS path for the PySpark code.
Specify the path for the required jar files.
Configure all required properties for the job as needed and then submit the job.
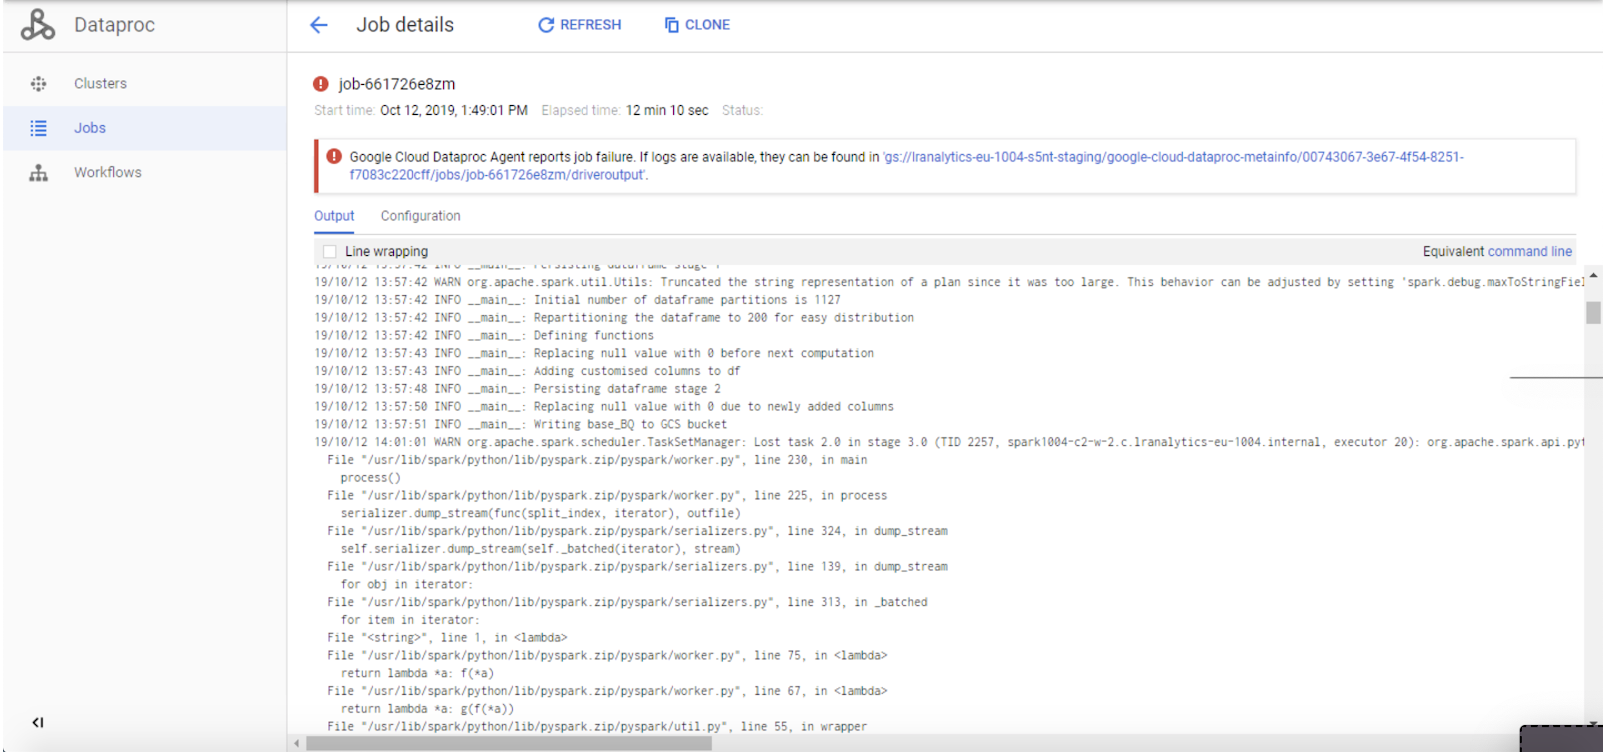
A typical job output will look like this:
There are several methods you can use to submit a job in the cluster.
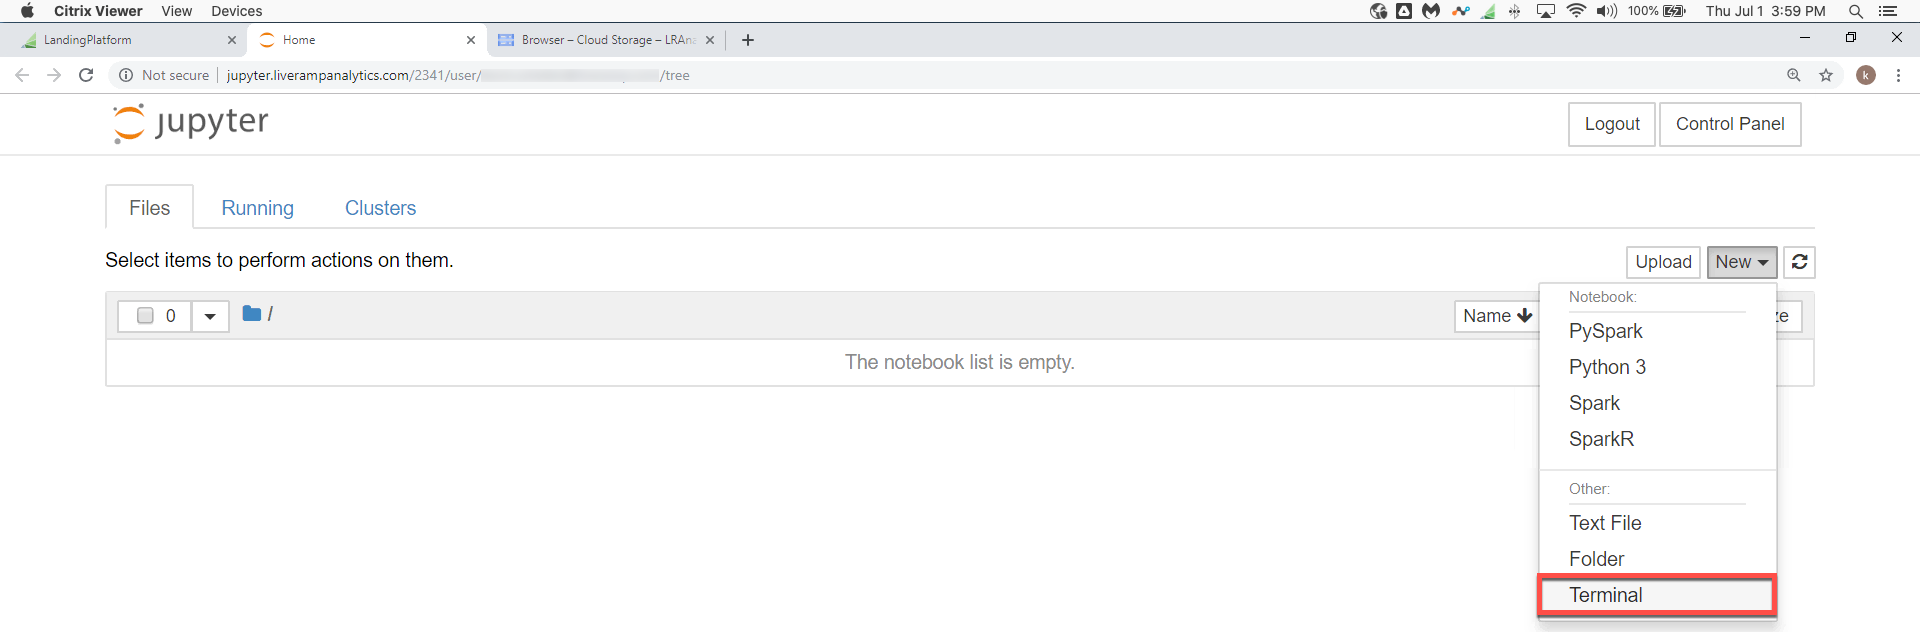
Use Jupyter → Notebook or Text Editor
Write your PySpark code and save it as a .py file.
You can generate your PySpark from your notebook. Keep these recommendations in mind:
Select all cells (SHIFT + J)
Merge cells (CTRL +M)
Remove Sparkmagic lines (2 first lines)
Save your notebook as a .py file
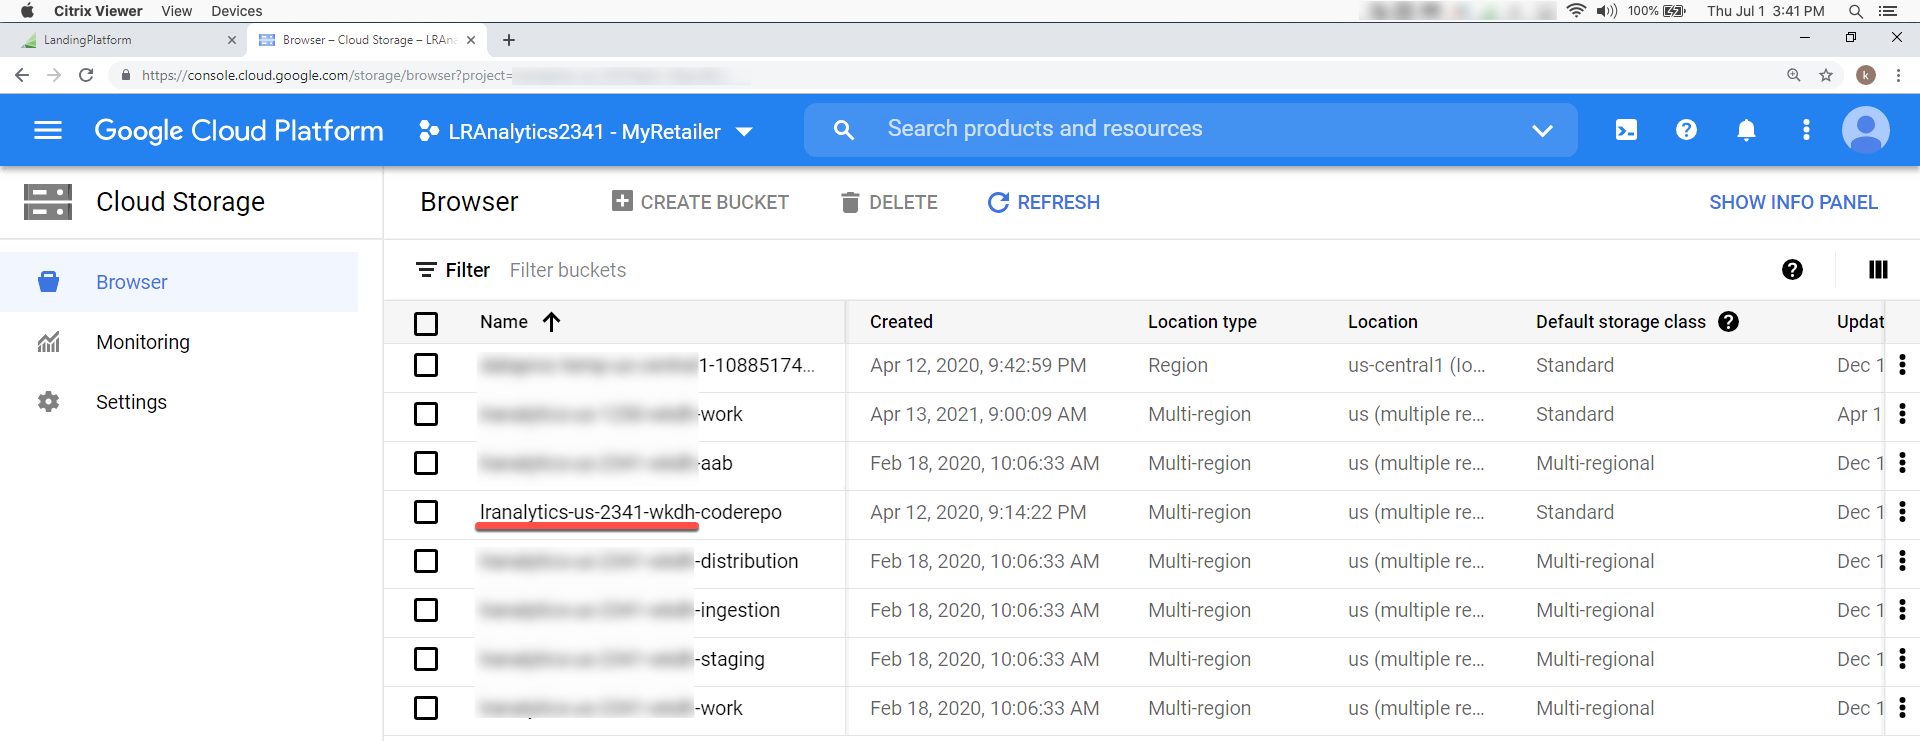
Push this .py file to GCS (coderepo bucket)
Use Jupyter → Terminal
Push your code to your organization's coderepo bucket.
Useful code example:
gsutil cp local_file gs://{name_of_your_GCP_bucket}-coderepo/{your_folder_name}/ .
Use GCP Console → Dataproc → Your Tenant Cluster
Create a job, set the job configuration (location of the .py file, Spark configuration, and dependencies), and then run your job.
Use GCP Console → Dataproc → Your Tenant Cluster → Your Job ID
Check the execution logs and then go to BigQuery to see the final result.
From the Jupyter terminal, you can use the command-line interface to perform the following basic operations (among others):
# List the content of a bucket
gsutil ls gs://{name_of_your_GCP_bucket}-coderepo/{your_folder_name}/
# Copy to the coderepo bucket
gsutil cp local_file gs://{name_of_your_GCP_bucket}-coderepo/{your_folder_name}/
# Copy from the coderepo bucket to local
gsutil cp gs://{name_of_your_GCP_bucket}-coderepo/{your_folder_name}/ .
# Copy a folder from the coderepo bucket to local
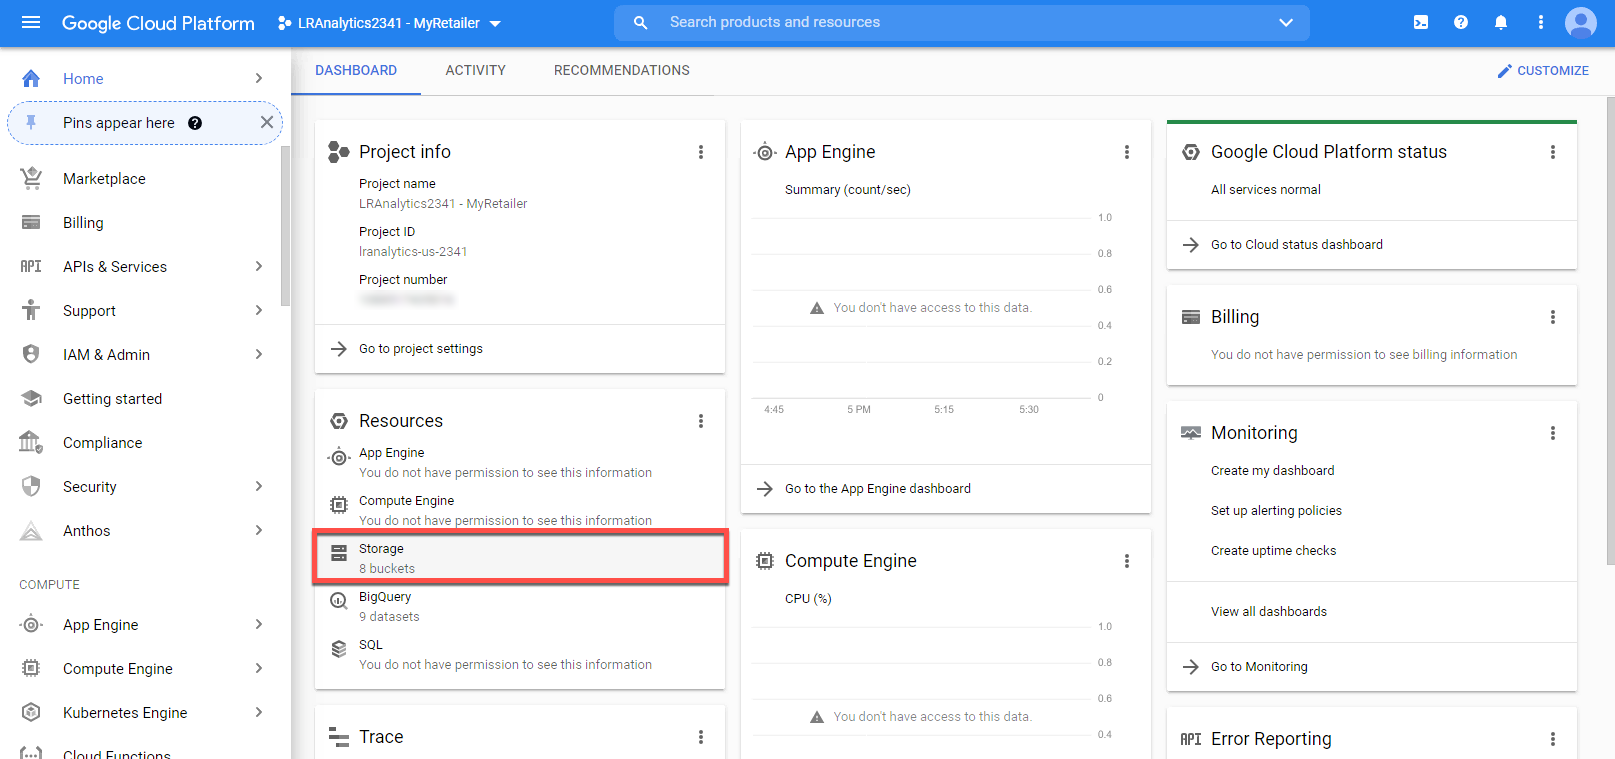
gsutil cp -r gs://{name_of_your_GCP_bucket}-coderepo/{your_folder_name}/ .Where {name_of_your_GCP_bucket}-coderepo/{your_folder_name}/ is replaced with the value in your GCP bucket, which you can find by going to Resources > Storage from the Analytics Environment's home page in GCP and searching for the bucket that has the "-coderepo" suffix.
After you save your notebook, open a terminal.
Tip
When running a Spark job on the server, make sure you stop your sparkContext at the end of the job. The last line should always be: "sc.stop()." Otherwise, the job will stay active on the server until timeout using resources.
Convert your notebook to a .py file with the following command:
jupyter nbconvert --to python my_notebook_name.ipynb
Open your .py file in Jupyter, and then remove the additional comments and the magic "%" commands as shown in the following example:
%load_ext sparkmagic.magics
%spark add -s session -l python -t None -u http://...
Logger Implementation
sc = spark.sparkContext

log4jLogger = sc._jvm.org.apache.log4j
LOGGER = log4jLogger.LogManager.getLogger(__name__)
LOGGER.info("pyspark script logger initialized")

LOGGER.info("Building query")
#Build sql script here

LOGGER.info("Initialising bq client")
bq = bigquery.Client()
Due to the verbosity of Spark default log:
Implement log4j logger
Not to be confused with the Python Logging function
Output readable log messages at key stages of execution
Allows for easy debugging of complex and long-running code
Clone a Job
Modify the .py file if necessary to handle any failing code.
Push the modified .py file to the bucket to overwrite the existing file.
Click on the Job-ID in the job list.
Select CLONE at the top of the page.
Give the new job a new unique ID and submit the job again.
Fine Tuning Job Parameters
The basic configuration needed to run a Spark job:
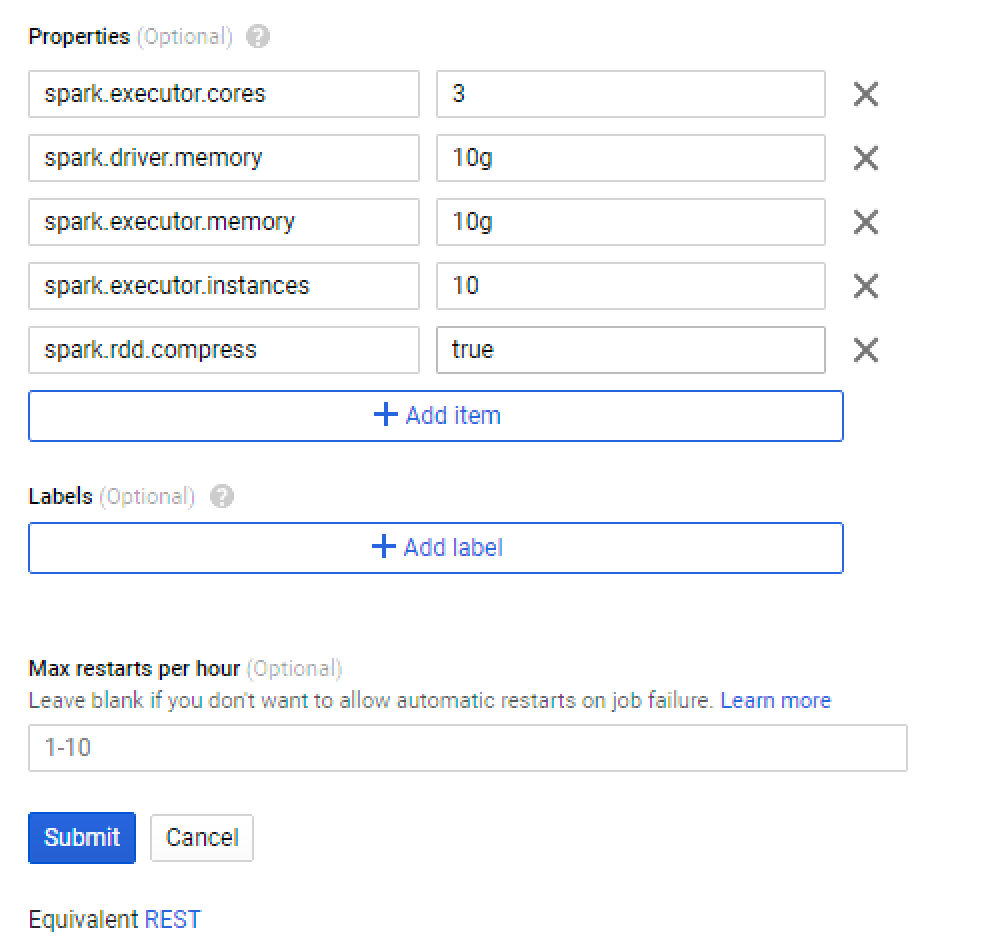
Use these property settings to run the most basic jobs.
The cluster will scale if more resources are needed.
Add more properties where required.
If the job fails due to any of the properties, increase the value parameter to suit specific cases.
Note
These settings are not needed for Jupyter Notebook jobs as this is best run with the default preconfigured settings.
Start a Dataproc Cluster
If your Dataproc cluster has stopped, you can start it by clicking in the Dataproc Console.
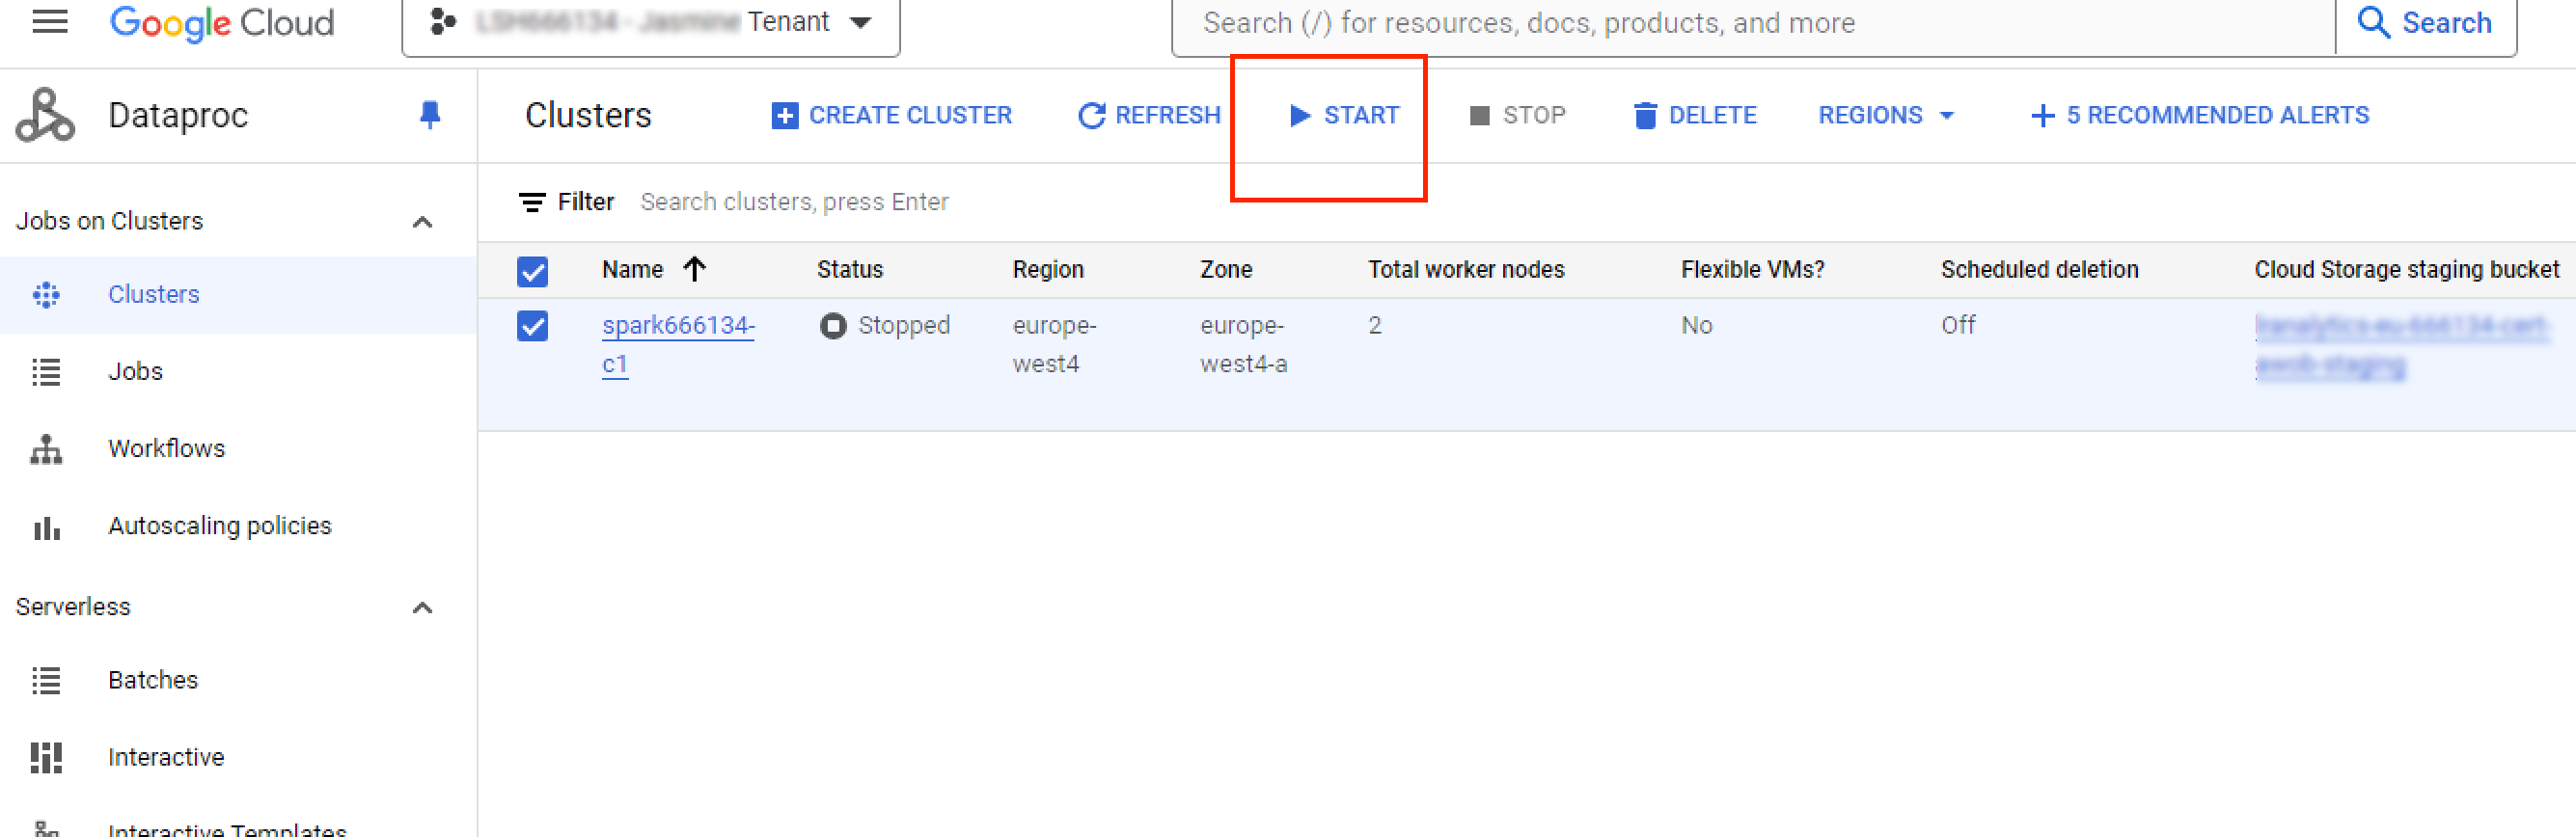
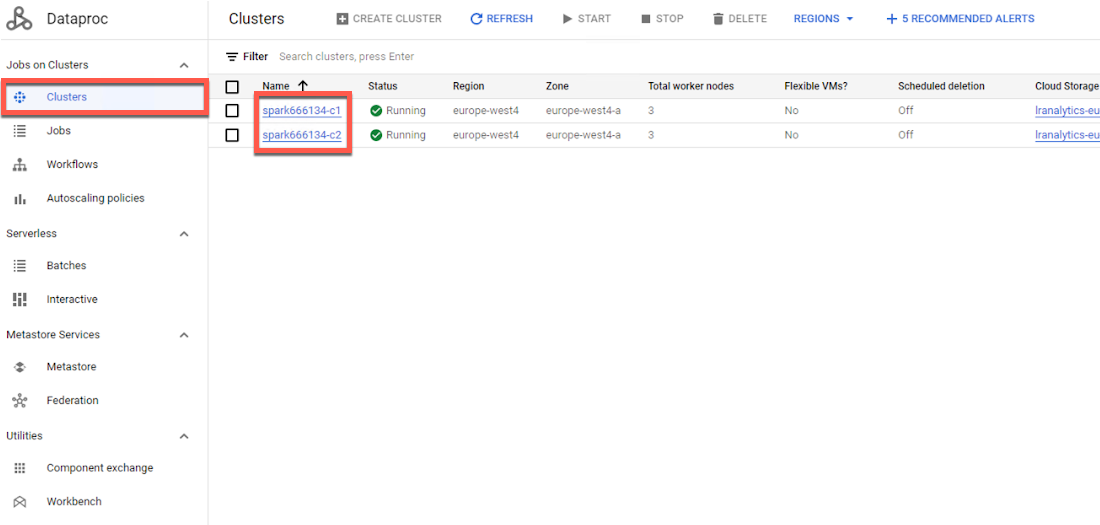
Users with the "LSH Data Scientist" persona can monitor (Read only) their Dataproc clusters in the Google Cloud console. If you need to manage your Dataproc clusters, create a case in the LiveRamp Community portal or contact your Customer Success Manager.
In your Google Cloud console, go to the Dataproc Clusters page.
Click in the left navigation pane, and then click the link for the cluster you want to monitor.
The Dataproc Console displays the Monitoring tab for the cluster.
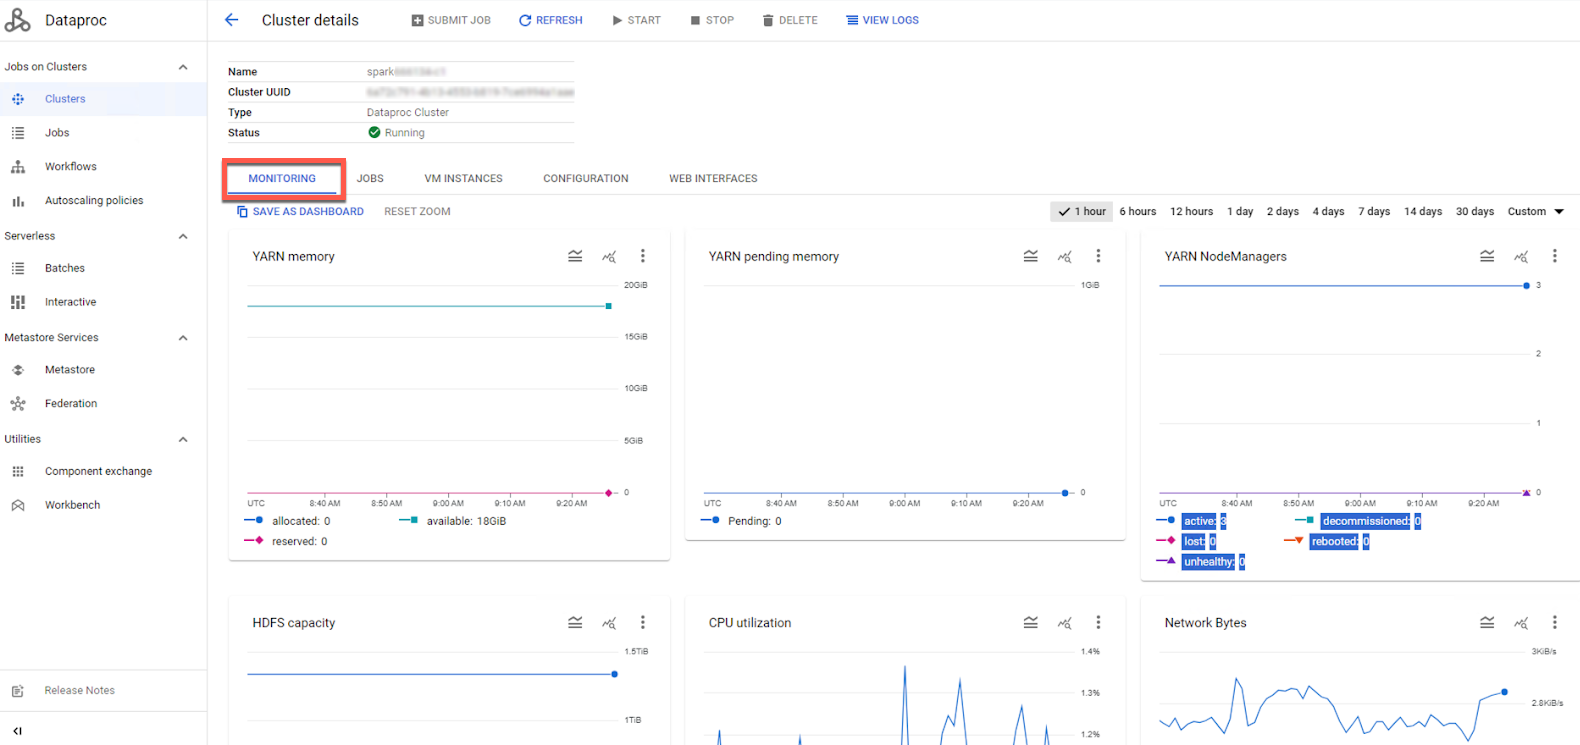
You can click the following tabs to view additional details:
Jobs
VM Instances
Configuration