ATS Analytics
For customers who've implemented ATS (Authenticated Traffic Solution), you can use ATS Analytics to measure and analyze ATS performance based on various metrics. The dashboard allows you to better understand and track the lift from ATS for the regions and domains included in your ATS Placement.
You can check out the full list of available metrics in Dashboard Metrics and Calculations.
To be able to view the analytics dashboard, you must first set up ATS Analytics in Console. See "Configure ATS Analytics for Prebid.js" to learn how.
Tip
To learn how you can improve the number of authenticated users and enrich your inventory, check out Strategies to Increase Authentications.
Analyze the Dashboards
Once you've configured ATS Analytics for Prebid.js, you can view the performance of your sites and a breakdown of this data based on technological aspects such as which browser your users run, which operating system, and others.
From the navigation menu, select the ATS Analytics tab. Then, select the Overview or Technology tabs.
Before you delve deep into the data, consider the following:
The default view displays data from the last 7 days.
The data shown are based on the web implementations of ATS and do not include ATS API or ATS Mobile SDK implementations.
All bids in other currencies are converted to U.S. dollars to show a unified picture.
Analytics data are updated on a daily basis at 03:00 UTC time zone.
The analytics data are based on sampled data and therefore might not be fully accurate.
Bidders who can decode envelopes are marked with an envelope icon. Prebid.js bidders who don't enable Sidecar cannot decode envelopes, so their dashboard metrics display lower CPMs. See List of Sidecar-Enabled Bidders for more information.
Caution
If the Overview section says that the placement is not receiving data, that indicates that no data are being sent to LiveRamp.
We recommend you upgrade your Prebid module to at least version 7.6.0. Then, check that everything is set up correctly. If everything looks OK but you still see no data displayed, contact our support team for further investigation.
Tip
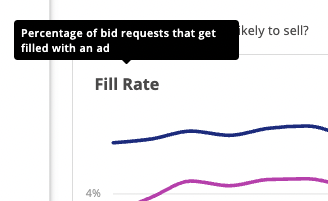
Hover over the metrics' headers to learn more information about them.
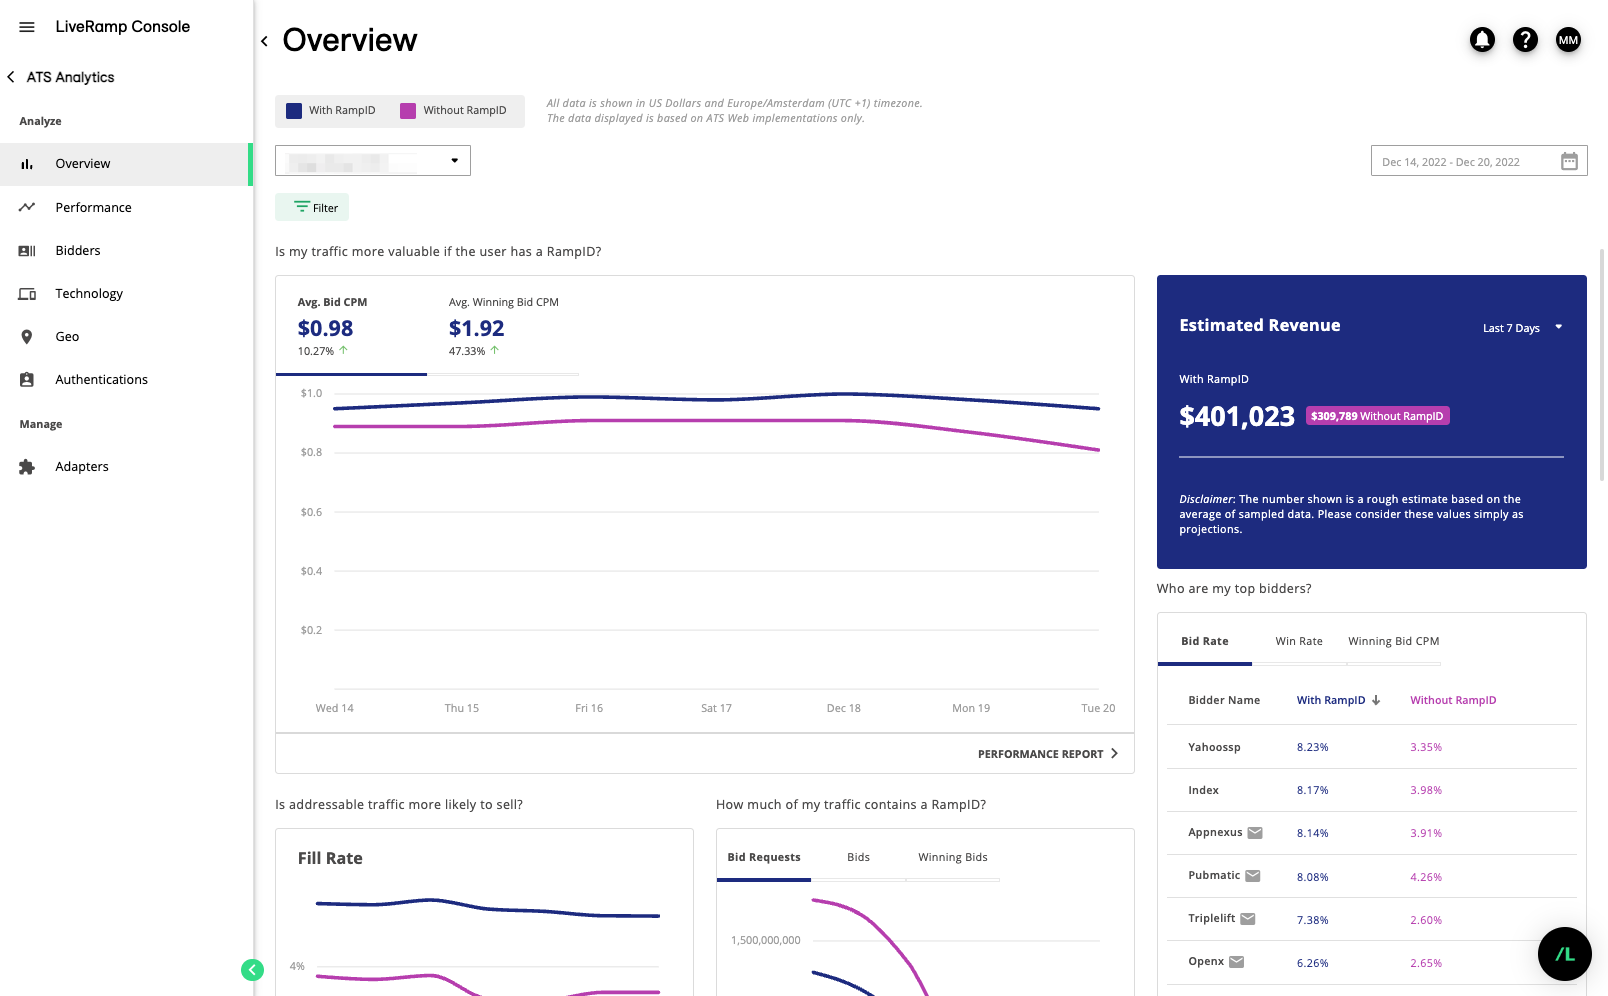
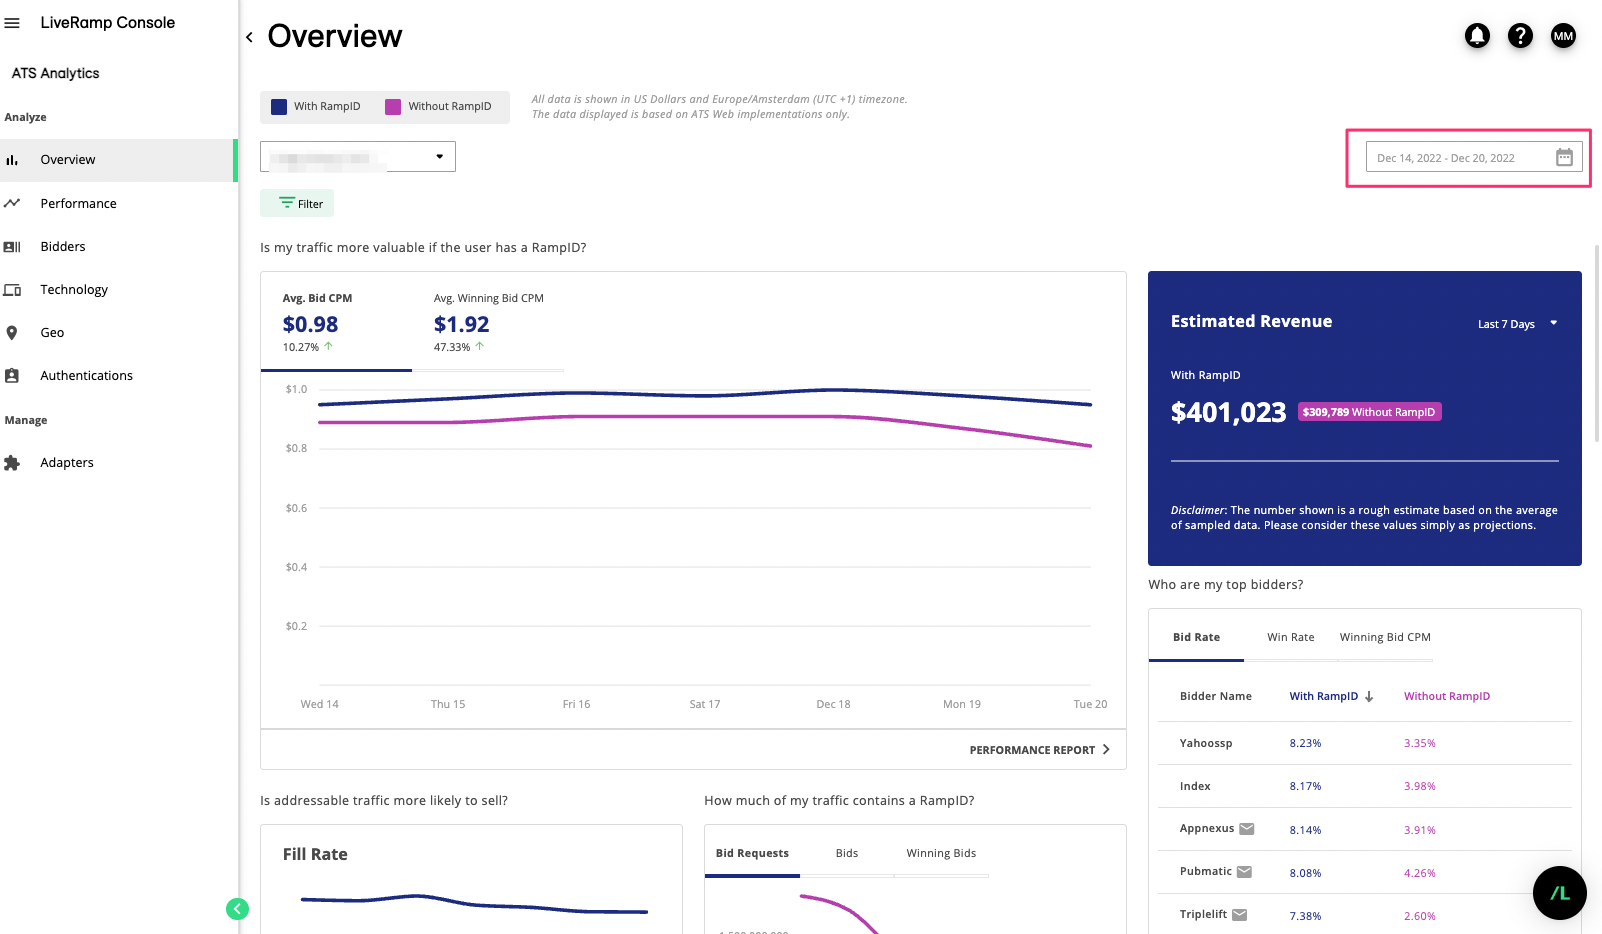
The Overview dashboard gives you a thorough insight on how your addressable traffic is performing. You can adjust your dashboard by selecting a placement, applying country and domain filters, and specifying a time frame.
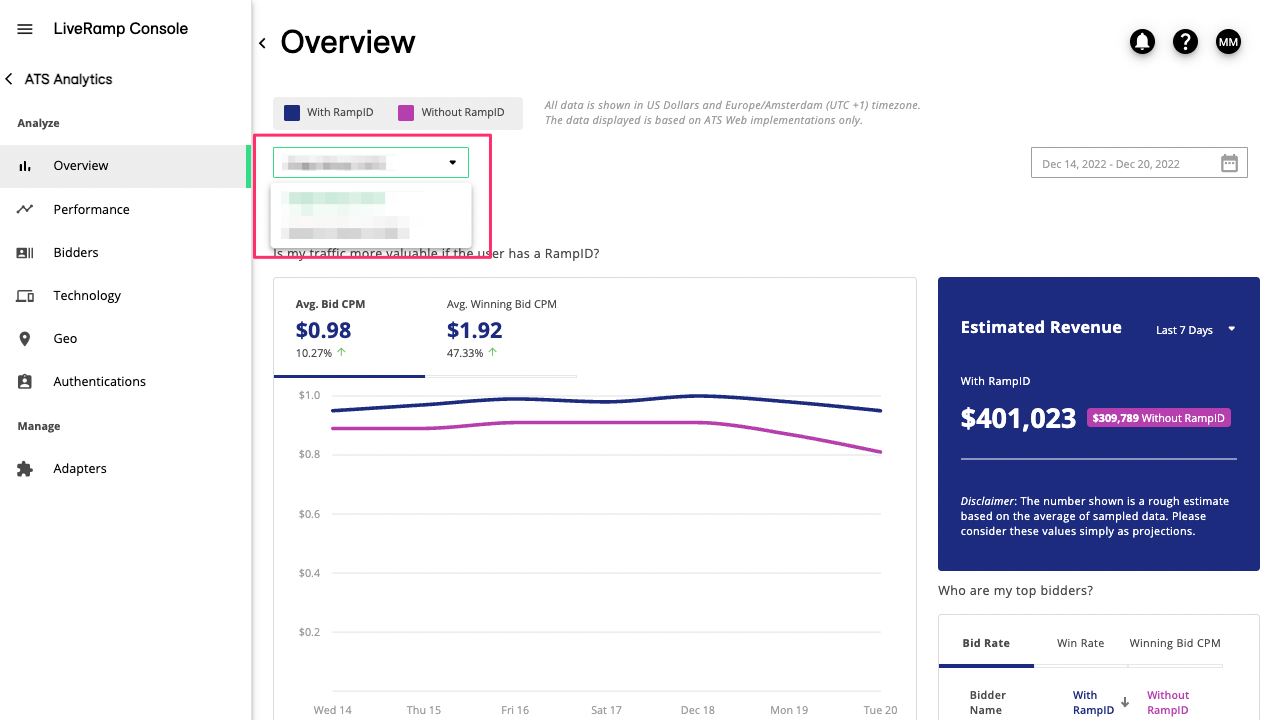
From the LiveRamp placement dropdown list, select the desired placement.
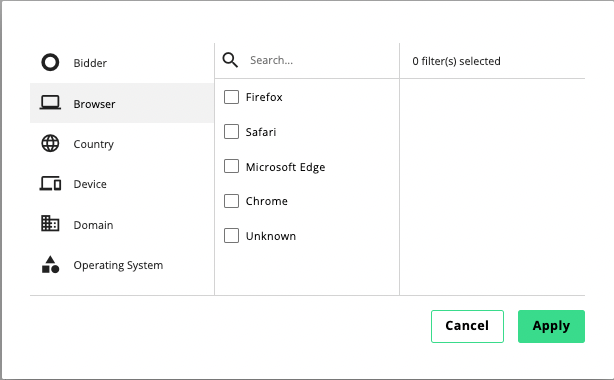
Use the filter to only display results based on selected countries or domains (within the selected placement):
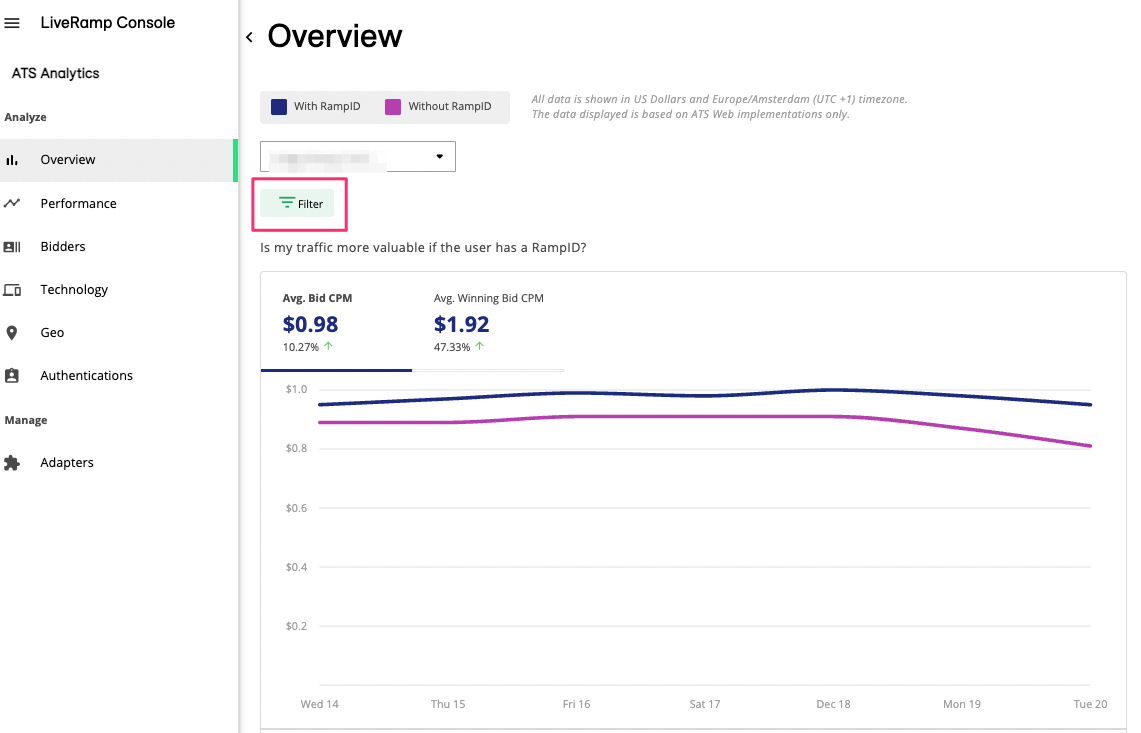
Click .
From the filter dialog, select the type of filter you want to apply and then check the check box(es) for the desired criteria.
Note
The domains available to filter on are based on the Domains/Bundle ID section of the selected placement's details page.
Repeat for any desired additional filter types.
Click .
If desired, use the data selector to change the selected time period.
The Performance dashboard provides you with a thorough overview of your website's bid performance per day; displaying data as soon as two days ago and each day before that. With this dashboard, you can keep a close eye on the bid traffic and efficiently analyze trends.
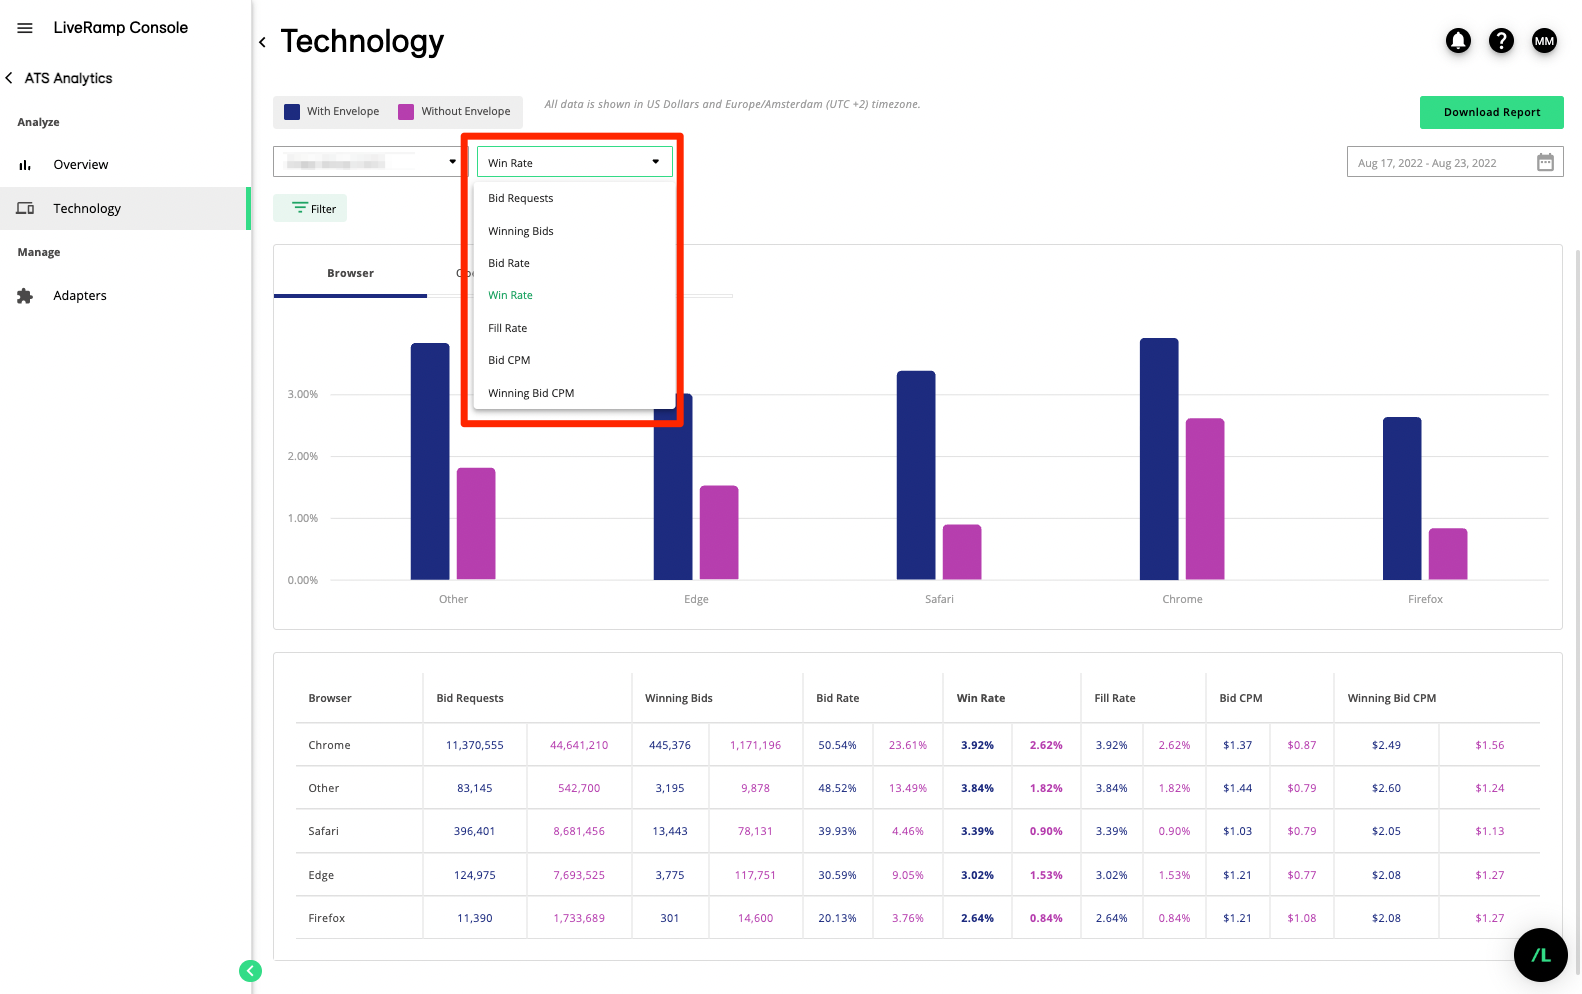
If you want to dive deeper into the technology topic, the Technology dashboard provides detailed insights on bidding performance for browsers, devices, and operating systems.
From the dropdown, select a placement.
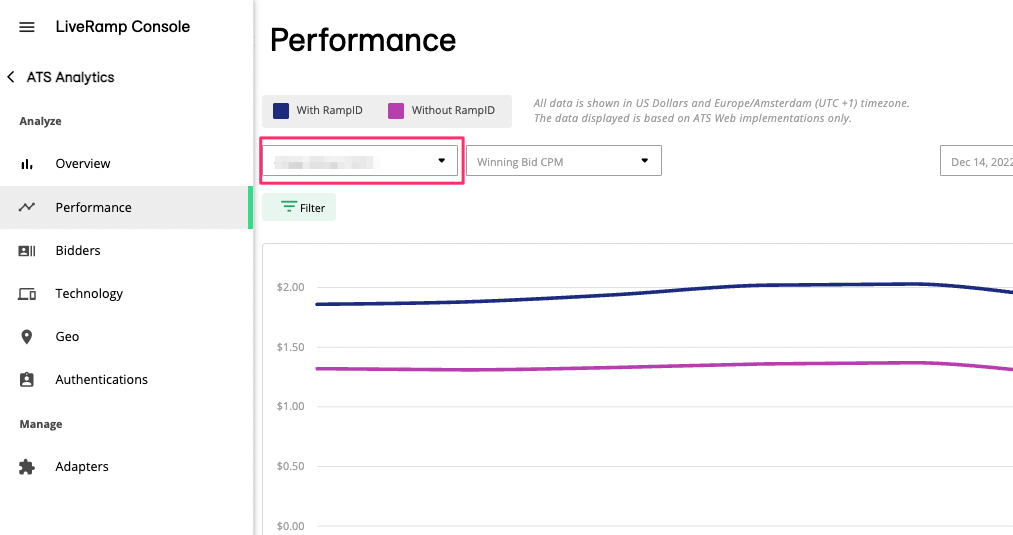
From the next dropdown, select one of the following options:
Bid Requests
Winning Bids
Bid Rate
Win Rate
Fill Rate
Bid CPM
Winning Bid CPM
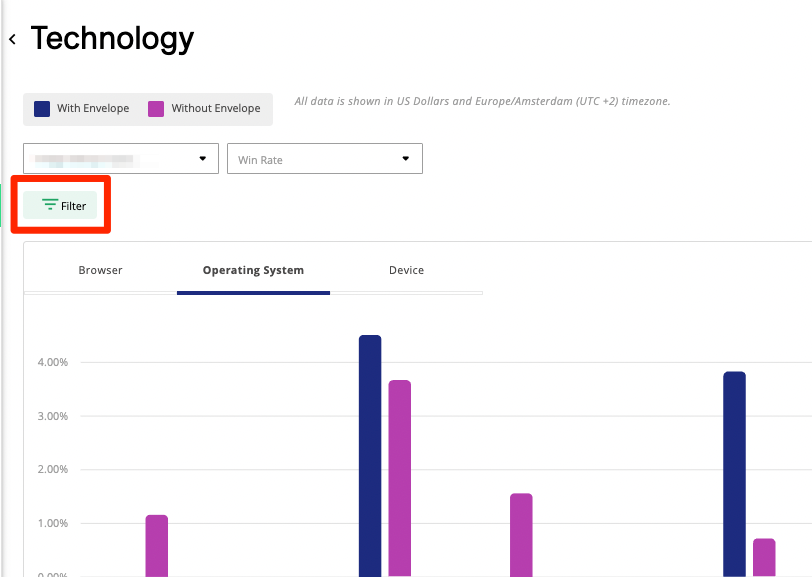
To filter the results, click the filter icon and select one of the following options:
Bidder
Browser
Country
Device
Domain
Operating System
Note
If you are using the Technology dashboard, you can alternate the view using the tabs on the top of the main chart to display an overview of the following data:
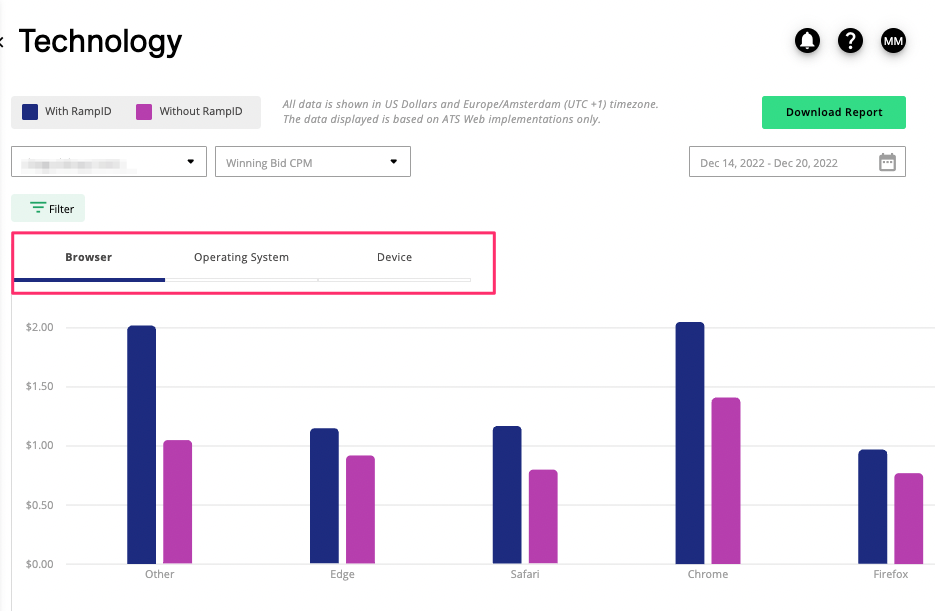
Browser
Operating System
Device
(Optional) Use the date picker to change the selected time period.
(Optional) Click to download the data currently displayed in a .CSV format.
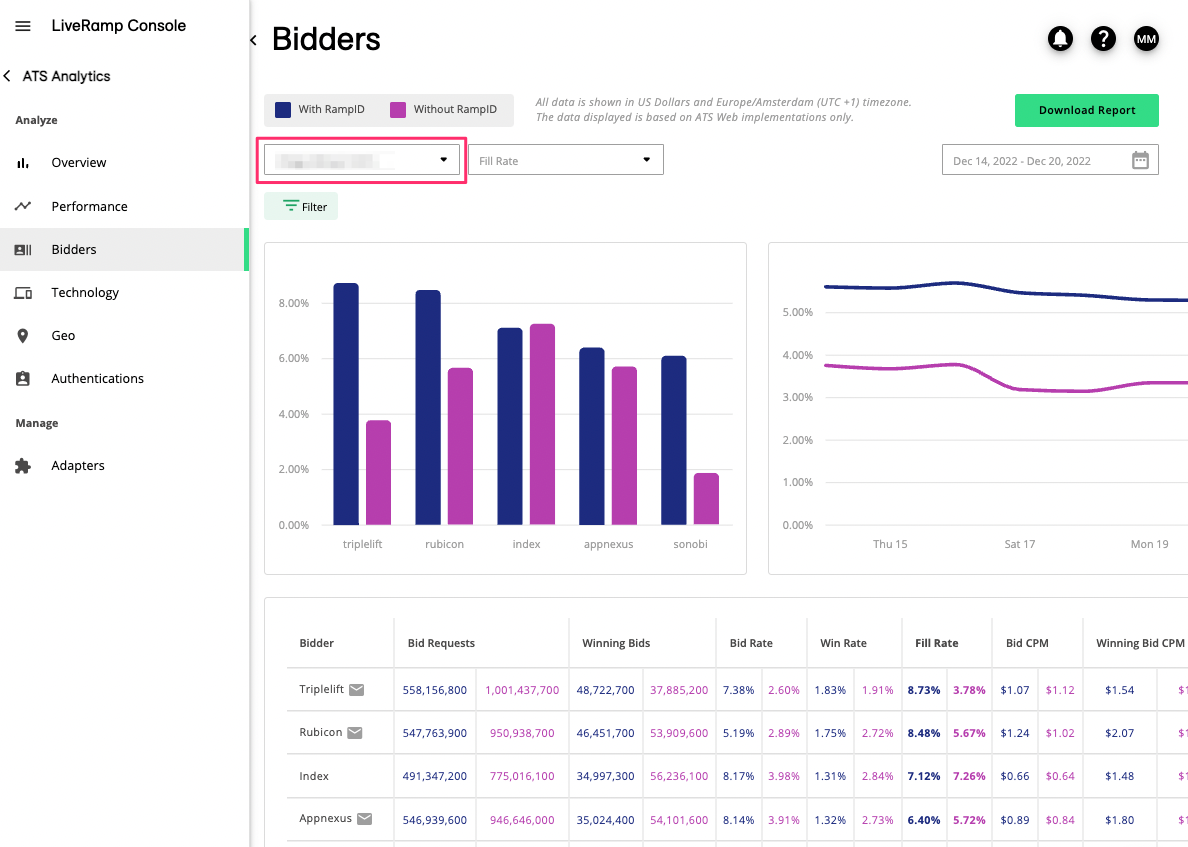
The Bidders dashboard provides more detailed insights into how your traffic is performing based on the bidders you are working with. This dashboard offers a way for you to quickly learn which bidders fill the most bid requests, which bidders have higher bid CPM, which bidders have the highest win rate, and so on.
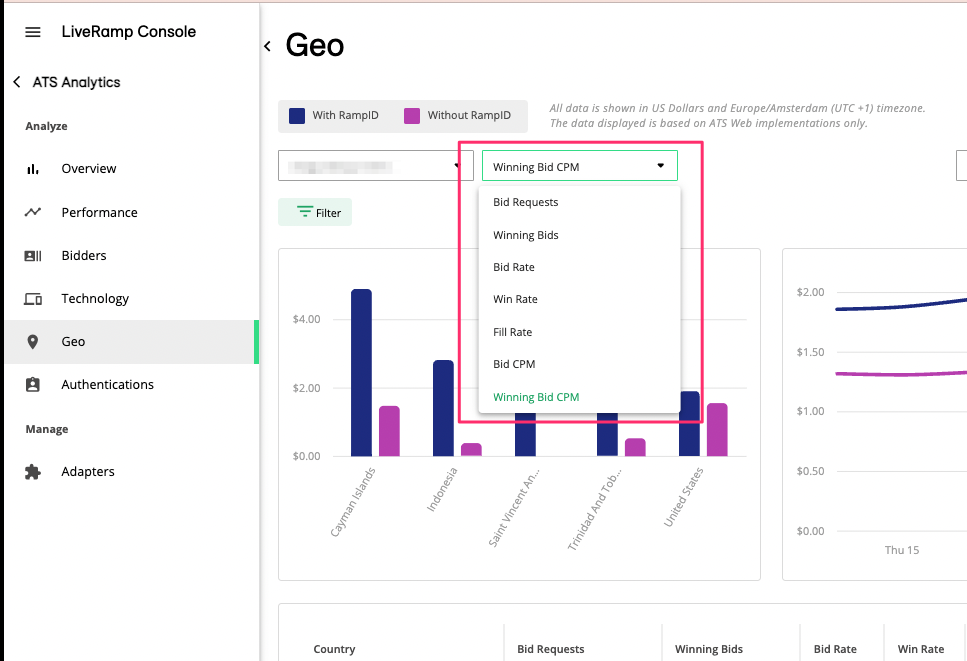
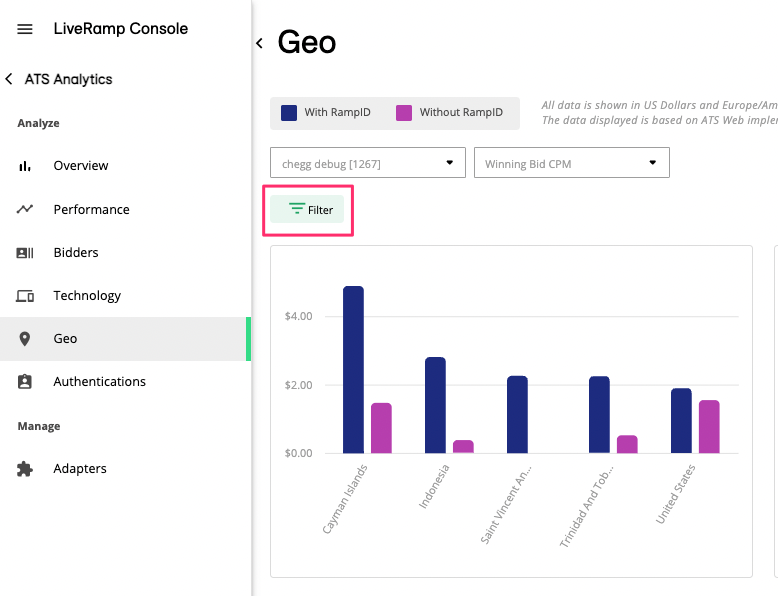
To understand how your websites perform based on the geographical locations of your users, you can select the Geo dashboard. You can configure the dashboard the display any data of your choosing.
From the dropdown, select a placement.
Click on the dropdown option next to it to select what data you want the charts to display. The following options are available:
Bid Requests
Winning Bids
Bid Rate
Win Rate
Fill Rate
Bid CPM
Winning Bid CPM
Use the filter icon to only filter the results based on specific selections of the following:
Bidder
Browser
Country
Device
Domain
Operating System
(Optional) use the data selector to change the selected time period.
(Optional) Click to download the data currently displayed in CSV format.
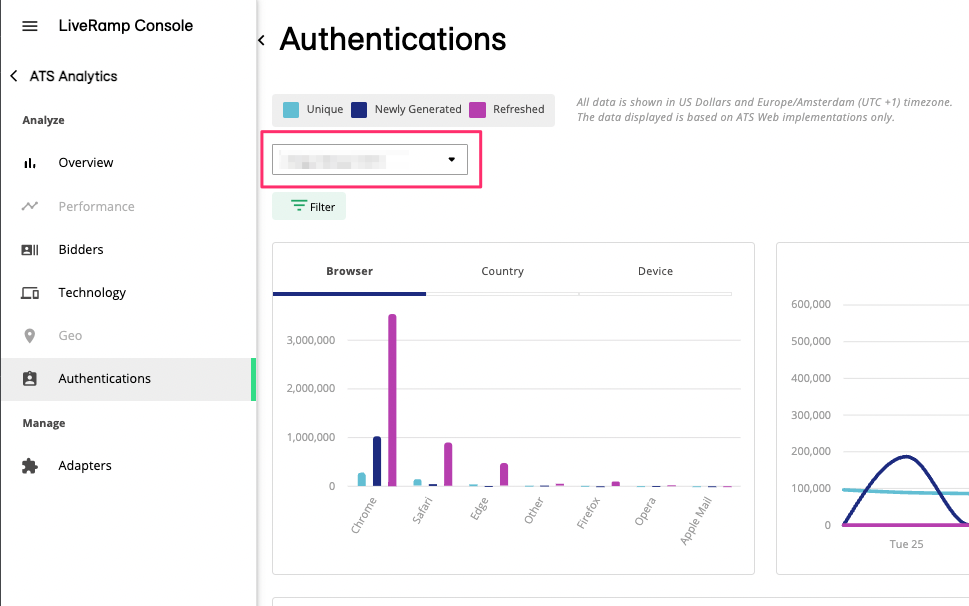
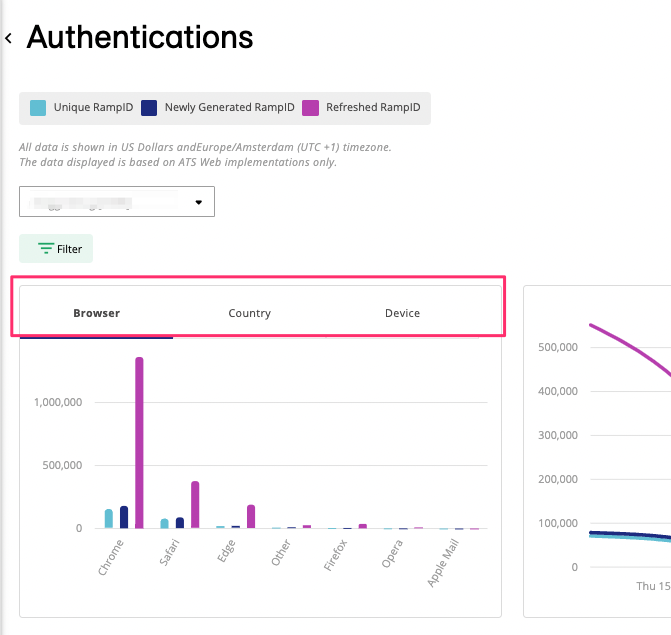
The Authentications dashboard gives you insights into your websites’ performance on authenticated RampID. Each RampID represents an individual. However, one RampID can be tied to multiple identifiers (email and phone) and multiple envelopes which are generated whenever a user authenticates.
The Authentications dashboard has the following main metrics:
Unique Authenticated RampIDs: Derived from requests to the envelope API endpoint, which includes new envelope creation and refresh envelope requests. It is determined by checking whether the RampID matched to the envelope is unique for the day. Cookie-based requests that rely solely on cookies without email or phone numbers are excluded.
Note
If multiple logins occur and LiveRamp determines that it's by the same user, this counts as one unique authenticated RampID.
Newly Generated Unique RampIDs: Derived from requests to the Envelope API endpoint to create new envelopes for the day. This occurs whenever a user authenticates (logs in) on your websites.
Refreshed RampIDs: Derived from requests to the Envelope API endpoint to refresh envelopes for the day. This occurs when a user who has previously logged in returns to your websites.
To learn more, see “Understanding the Unique Authenticated RampID Metrics”.
You can compare the number of unique authenticated RampIDs and the number of generated authenticated RampIDs across browsers, countries, and devices to help you pinpoint where improvements are needed. To configure the authentications dashboard:
From the dropdown, select a placement.
Use the filter icon to filter the results based on specific selections of the following:
Browser
Country
Device
Domain
Operating System
You can alternate the view using the tabs on the top of the main chart to display an overview of the following data:
Browser
Country
Device
If desired, use the data selector to change the selected time period.
Optionally, you can click to download the data currently displayed in CSV format
Manage ATS Analytics Adapters
In the Adapters tab, you will be able to create and manage existing analytics adapters. You can learn more about creating analytics adapters in Configure ATS Analytics for Prebid.js.
To delete an analytics adapter, simply click on the three dots icon, and select .